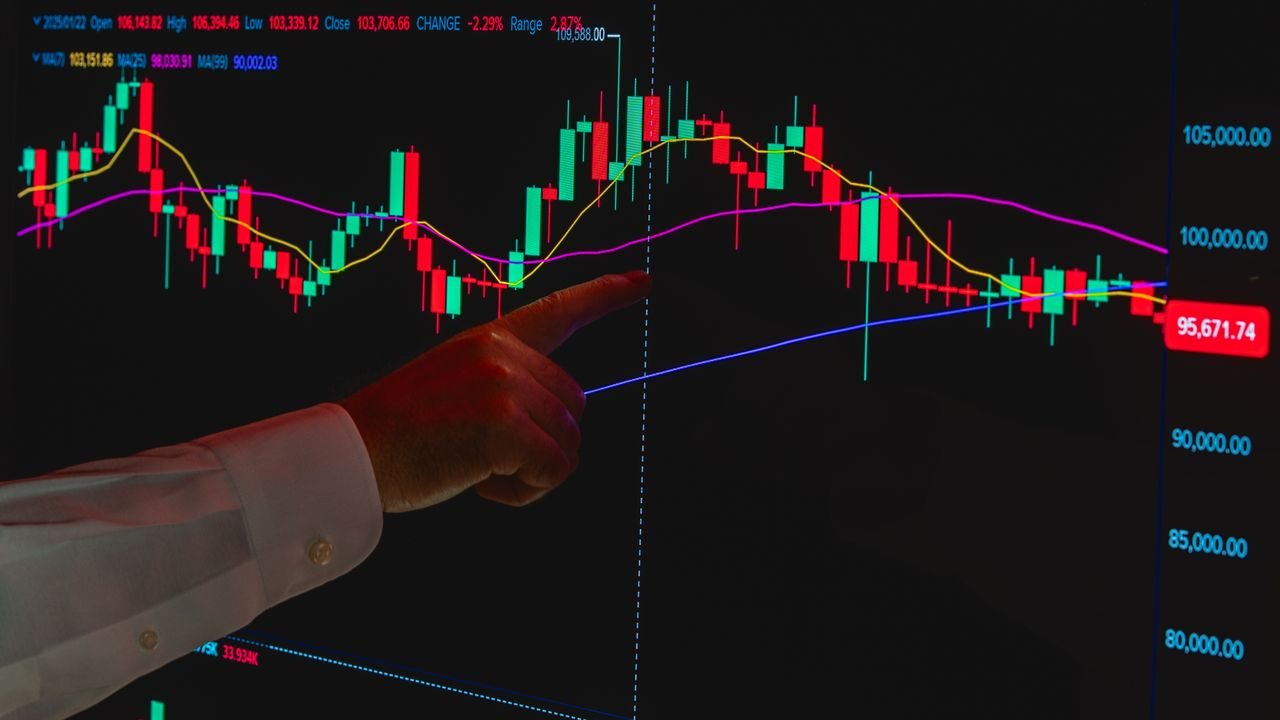

Nasdaq 100 price action trading means reading the US100 from its own chart: the prior day’s levels, the opening reaction and the way price behaves at zones, rather than relying on indicators or tips. For a UK trader, it also means knowing when the index actually moves in UK time and sizing for one of the busiest markets on any platform.
Quick answer: how do you trade the Nasdaq 100 with price action?
Mark the prior day’s high, low and close plus any clear supply and demand zones. Let the US open at 14:30 UK time (13:30 for a few weeks around the clock changes) settle for 15–30 minutes. Then trade only a clean reaction at a marked level, with a stop beyond the structure and a stake sized in £ per point.
What the US100 is and how it compares
The Nasdaq 100 tracks 100 of the largest non-financial companies listed on the Nasdaq stock exchange. It is weighted by company size, so a handful of very large technology businesses carry a big share of every move. On platforms you will see it called US100, US Tech 100 or NAS100.
That concentration is why it often moves further than the indices UK traders know best. The table compares the three most common choices.
| Factor | Nasdaq 100 (US100) | FTSE 100 | S&P 500 (US500) |
|---|---|---|---|
| Cash hours (UK time) | 14:30–21:00 | 08:00–16:30 | 14:30–21:00 |
| Sector mix | Heavy in technology | Banks, energy, miners, staples | Broad US economy |
| Typical behaviour | Fast, large daily ranges | Steadier, smaller ranges | Between the two |
| Single-stock earnings risk | High: a few names dominate | Moderate | Moderate |
| Main scheduled movers | US data, Fed, megacap earnings | UK data, commodities, sterling | US data, Fed, earnings |
If you already trade the S&P 500, our US500 market profile review with short-term levels is a useful comparison.

When to trade the Nasdaq 100 from the UK
The US cash session runs from 9:30 to 16:00 New York time, which is 14:30 to 21:00 in the UK for most of the year. Your spread bet or CFD will usually quote prices almost around the clock, but the real volume arrives with the US cash open.
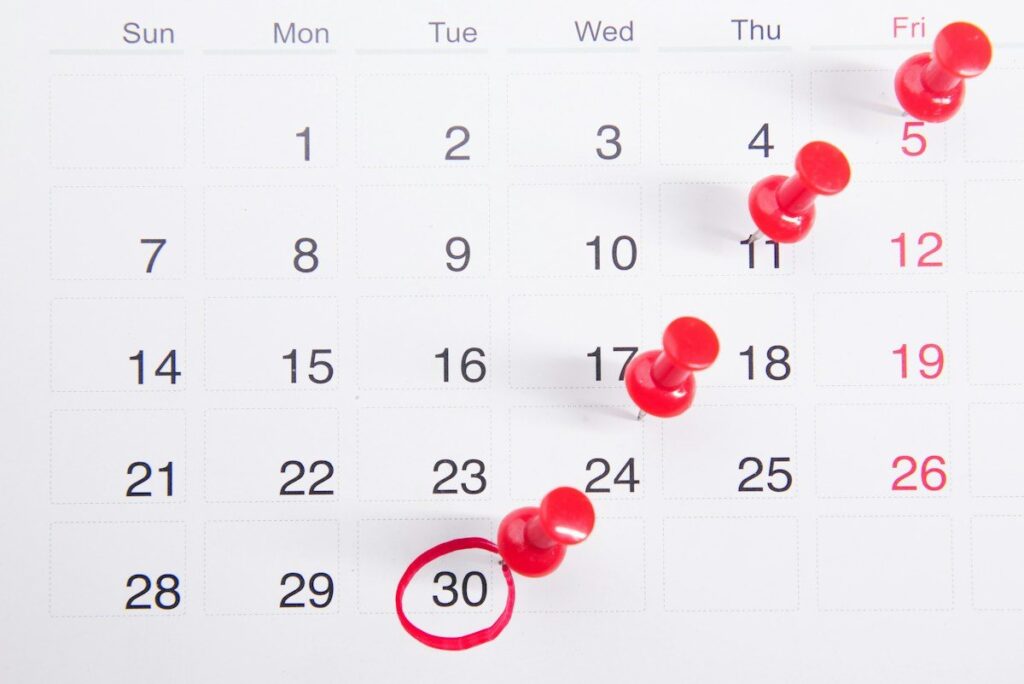
The trap is the clock change. The US and UK move their clocks on different dates, so for a few weeks each spring and autumn the open lands an hour earlier for us. In autumn 2026, UK clocks go back on 25 October and US clocks on 1 November, so that week the open is at 13:30 UK time and the close at 20:00.
The windows we watch:
- 13:30 UK: major US data such as inflation and jobs reports, released before the open
- 14:30–15:00 UK: the open, where the gap is filled or extended and the first range forms
- Mid-session: often slower, with cleaner tests of the levels marked earlier
- 19:00 UK: Federal Reserve rate decisions, on the days they fall
How to trade the Nasdaq 100 with price action
We keep the same routine every day, so the speed of this market does not rush the decision. It follows the process from our guide to top down chart analysis from weekly to entry timeframe, applied to one index.
1. Mark the levels before the open
Before 14:30, mark the prior day’s high, low and close, the overnight range and any obvious round numbers. Add the clear zones on the 1-hour and 4-hour charts, drawn the way we explain in how to draw supply and demand zones.
2. Read the gap and let the open settle
If the open is well above or below yesterday’s close, the gap tells you which side was in control overnight. We rarely act in the first 15 minutes, because spreads widen and price often probes both sides of the early range before it picks a direction.

3. Trade a reaction, not a prediction
We want price to reach a marked level and show us something: a rejection, a failed break or a clean hold after a breakout. Our guide on how to avoid false breakouts at the US open covers the difference, and the wider method sits in our guide to what price action trading is.

Volatility, gaps and earnings-season risk
US100 trading carries risks that a slower market hides. A gap can open straight through your stop, and fast moves around data cause slippage.
Earnings season adds single-company risk to an index trade. Many of the largest constituents report after the US close, so one result can move the whole index overnight. We check the earnings calendar weekly and avoid holding through the biggest names unless the stake allows for a gap.
In extreme sell-offs, US exchanges can pause trading. The SEC’s investor education site explains the market-wide circuit breakers at 7%, 13% and 20% falls in the S&P 500, and the separate pauses for individual stocks. They are rare, but a stop is never a promise of the price you get.
Worked example: sizing a US100 trade in £ per point
Example: on a £5,000 account, risking 1% means £50 on the trade. Our approach to how much to risk per trade explains why we keep that figure small and fixed.
Say the US100 is at a hypothetical 18,000 and holds above the prior day’s low after the open. A stop beyond that structure sits 40 points away. The stake is £50 ÷ 40 = £1.25 per point, worked out with the formula in our guide on how to calculate position size for a spread bet.
That stake controls £1.25 × 18,000 = £22,500 of index exposure. UK retail rules cap leverage on major index CFDs and spread bets at 20:1, so the margin is about £1,125. Leverage magnifies losses as well as gains, and a gap can take you past a 40-point stop.
From the desk (March 2020)
This post began in March 2020 as Karl’s note on a Nasdaq trade he shared with our community. His original line is below. The video it pointed to is not part of this page, and we have not recreated the trade.
Today’s Nasdaq trade, I sent this out in our Discord.
Common mistakes
- Trading the first five minutes of the open, when spreads are widest and direction is least clear
- Missing the clock-change weeks and arriving an hour after the open
- Sizing by feel at £5 or £10 per point without measuring the stop
- Holding through a megacap earnings report or a Fed decision by accident
- Moving the stop in a fast market; read where to place a stop loss using price action before the trade, not during it
Frequently asked questions
What time does the Nasdaq open in the UK?
The US cash session opens at 14:30 UK time and closes at 21:00 for most of the year. For a few weeks in March and in late October to early November, the clocks change on different dates and it opens at 13:30.
Is the Nasdaq 100 more volatile than the FTSE 100?
Usually, yes. It is concentrated in large technology companies, so its daily ranges are typically wider in percentage terms. Set stops and stakes for this market rather than copying them from the FTSE.
What is the difference between US100, NAS100 and US Tech 100?
They are platform names for the same underlying Nasdaq 100 index. The exact price can differ slightly between providers, depending on whether they price from the cash index or the futures.
Can I trade the US100 outside US market hours?
Many providers quote it for most of the day. Volume is much thinner before the US open, so spreads widen and moves are less reliable. That is one reason we treat when not to trade as part of the plan.
Next steps
Start with the method in our guide to how to read price action candle by candle, then apply it to the US100 with small, fixed risk. If you want a structured route, the free basics section of our price action trading course covers the foundation, including when not to trade and how to judge whether a trade is worth the risk.
This article is for education only and is not financial advice. Trading leveraged products such as CFDs and spread bets carries a high risk of losing money.