
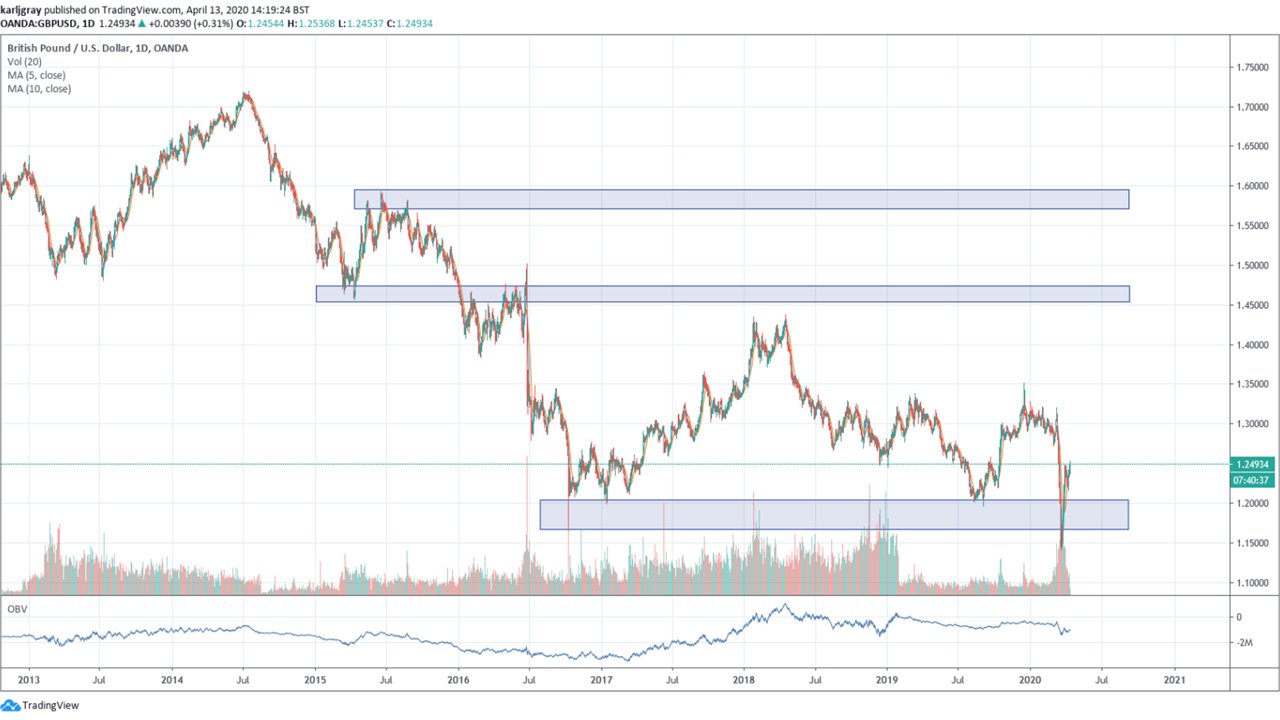
Take a look into how I break down the charts, with predictions on the moves I’d expect to see happen!
That was how Karl introduced this post, and the process behind those predictions is top down chart analysis. You start on the highest timeframe to judge direction, then step down to find structure, a setup and finally an entry, so every trade agrees with the bigger picture.
Quick answer: what is top down chart analysis?
Top down chart analysis means reading a market from the highest timeframe to the lowest. 1) The weekly or monthly chart sets the bias, 2) the daily chart marks structure and key levels, 3) the 4-hour or 1-hour chart shows the setup, and 4) the entry timeframe gives the trigger and the stop.
What top down chart analysis is and why the order matters
Every market is trending, ranging or turning on several timeframes at once. A 1-hour downtrend can be a small pullback inside a strong weekly uptrend. If you only look at one chart, you cannot tell which story you are trading.
Working from the top down fixes the order of decisions. The higher timeframe decides whether you look for buys, sells or nothing. The lower timeframes only decide where and when.
The opposite habit, bottom-up, is where many beginners start: they spot a pattern on a 5-minute chart and only then check the daily, if at all. That usually means trading against the market’s main flow without knowing it.

Choosing your timeframes for multiple timeframe analysis
There is no single correct set. The right stack depends on how long you hold trades, which is why the style you trade matters as much as the method. If you are not sure yet, start with which type of trading suits you.
Research supports the idea that horizon changes the picture. A CFA Institute Research Foundation review of technical analysis notes that technical traders are not one homogeneous group and that results depend on the time horizon used.
A practical rule is to keep each timeframe roughly four to six times the one below it. Common stacks look like this:
- Position trading: monthly, weekly, daily
- Swing trading: weekly, daily, 4-hour, with a 1-hour entry
- Intraday trading: daily, 1-hour, 15-minute, with a 5-minute entry
Three or four timeframes is plenty. Add more and one will always disagree. Our guide to multiple timeframe analysis shows which chart does which job and what to do when they disagree.

How to break down a chart: the top-down walkthrough
Here is our routine for a swing trader. Intraday traders shift each step down a level.
Step 1: monthly and weekly charts set the bias
Strip the chart back to clean candlesticks. Ask one question: is price making higher highs and higher lows, lower highs and lower lows, or neither? Mark the two or three biggest zones where price has turned sharply before.
If you need a refresher on reading the candles themselves, see how to read candlestick charts for beginners.
Step 2: the daily chart shows structure and key levels
The daily chart is where most of the work happens. Mark the recent swing highs and lows, draw your supply and demand zones and note whether the latest swing broke structure or respected it.
This is the level where trend changes first become visible. Our guide on how to identify a new trend early covers the signs to look for, and how to draw supply and demand zones covers the zones.
Step 3: the 4-hour or 1-hour chart reveals the setup
Now look for a setup that agrees with the bias: a pullback into a daily demand zone in an uptrend, for example. If price is between levels, there is no setup yet. If you like an indicator to confirm the setup, our guide to the best technical indicators for beginners shows how to use them alongside price action.
Step 4: the entry timeframe gives the trigger and the stop
Only when price reaches your area do you drop to the entry timeframe. You want a clear trigger, such as a break of a small lower high, and a logical place for the stop beyond the swing that would prove you wrong.

Before you place anything, run through a short checklist:
- Write the higher-timeframe bias in one word: up, down or range.
- Name the daily level the trade depends on.
- Confirm the setup points the same way as the bias.
- Define the trigger, the stop and the target.
- Check the reward justifies the risk before entering.
| Timeframe | What you look for | Decision it informs |
|---|---|---|
| Monthly / weekly | Trend direction, major zones | Buy, sell or stand aside |
| Daily | Swing structure, key levels | Where a trade makes sense |
| 4-hour / 1-hour | Pullback or setup into a level | Whether a setup exists now |
| Entry (15m to 1h) | Trigger, invalidation swing | Exact entry and stop |
When the timeframes disagree
They often will. The rule we follow is simple: the higher timeframe wins, and disagreement is a reason to wait, not a reason to search for a better chart.
If the weekly is up and the daily is falling, the daily fall may be a pullback you can later buy. If the weekly itself is unclear, the honest answer is often to do nothing, which is a skill in its own right. We cover it in knowing when not to trade.
It helps to treat the higher timeframes as filters and the entry chart as the trigger. That is the idea behind our filters and triggers process for entries.
Worked example: a hypothetical swing trade
Example: a trader with a £5,000 account studies a hypothetical market. The weekly chart shows higher highs and higher lows, and the daily chart has pulled back into a demand zone that held twice before. On the 1-hour chart, price breaks a small lower high inside that zone.
The stop goes 40 points below the 1-hour swing low. Risking 1% means £50, so on a spread bet the stake is £1.25 per point. Spread bets are leveraged, so a gap through the stop can cost more than planned and losses can mount quickly.
The target is the last daily swing high, 100 points away, giving a reward of two and a half times the risk. If the 1-hour trigger had appeared while the weekly trend pointed down, the same pattern would be skipped. For sizing, see how much to risk per trade.

Common mistakes in multiple timeframe analysis
- Timeframe shopping. Flicking through charts until one agrees with the trade you already want.
- Too many timeframes. Five charts give five opinions and no decision.
- Starting at the bottom. Finding a pattern first and checking the trend afterwards.
- Entering on the higher timeframe’s stop. Daily-sized stops with entry-chart expectations rarely fit your risk.
- Ignoring the gap between levels. A setup straight into a weekly zone has little room to run.

Most come from treating each chart separately. To read every chart as one story, start with how to read price action on any timeframe.
Frequently asked questions
Which timeframes should I use for top-down analysis?
Choose three or four timeframes about four to six times apart, based on how long you hold trades. Swing traders often use weekly, daily and 4-hour with a 1-hour entry. Intraday traders shift each step down.
What do I do when the daily and 4-hour charts disagree?
Give priority to the daily chart. A 4-hour move against it is often a pullback, so wait for the lower timeframe to turn back in line with the daily before acting.
Does top-down analysis work for day trading?
Yes, the same order applies with shorter charts. A day trader might use the daily for bias, the 1-hour for levels and the 5-minute or 15-minute for entries.
How long should a top-down analysis take?
Once it is routine, a few minutes per market. The weekly and daily work only needs updating once a week or once a day.
Next steps
Top-down analysis sits inside a wider method. Our guide to what price action trading is and how it works brings the pieces together.
If you want a structured route from foundations to psychology, the basics section of The Two Traders price action trading course is free.
This article is for education only and is not financial advice. Trading leveraged products such as CFDs and spread bets carries a high risk of losing money.