Intermarket analysis for beginners comes down to one idea: markets are connected, so a move in one often helps explain a move in another. The US dollar, gold, stock indices, the yen and even crypto pull on each other through interest rates and investor mood. Learn the usual links, and when they break, and your own charts start to make more sense.
Quick answer: what is intermarket analysis?
Intermarket analysis is the study of how related markets influence each other, such as the US dollar and gold, stocks and safe-haven currencies, or oil and commodity currencies. Traders use these links as background and confirmation, not as entry signals, because correlations shift over time and can break down completely during shocks.
What intermarket analysis means, and what it does not
Every chart you trade sits inside a bigger picture. Money moves between currencies, bonds, equities and commodities as interest rates and sentiment change, and those flows leave footprints across several markets at once.
It is not a trading system. A relationship between two markets tells you about the backdrop, while price action at your own levels still decides the trade. We treat it as one of the filters in our filters and triggers trade entry checklist, never as the trigger itself.

Correlation in plain English
Correlation measures how closely two markets move together, on a scale from +1 (always together) to -1 (always opposite). Zero means no consistent relationship. A reading of -0.3 is a loose tendency, not a rule.
The correlation between gold and the dollar
Gold is priced in US dollars. When the dollar strengthens, an ounce costs more for buyers using other currencies and demand can soften; when the dollar weakens, the reverse happens. That is the root of the well-known inverse correlation between gold and the dollar.
Interest rates sit behind both. Gold pays no interest, so rising real yields (interest rates after inflation) raise the cost of holding it, and they also tend to support the dollar. Our guide to what moves the US dollar covers the rates and data side in more detail.
When gold and the dollar rise together
In a genuine panic both can climb at once, because investors want safety and both are treated as havens. So a rising dollar does not automatically mean gold must fall. For the gold chart itself, see our price action approach to trading gold.

Risk on, risk off: the mood that links markets
Risk on risk off describes the market’s appetite for risk. In risk-on phases investors buy growth: equities rise and higher-yielding, commodity-linked currencies such as the Australian dollar firm up. In risk-off phases the flow reverses and money heads for shelter.
The usual shelters are:
- Japanese yen (JPY): tends to strengthen when traders unwind positions funded in low-yielding yen.
- Swiss franc (CHF): a traditional haven backed by Switzerland’s large external assets.
- Gold: bought as a store of value when confidence falls.
- US dollar and government bonds: the deepest, most liquid places to park money in a scramble.
If equities are falling hard while the yen and franc rally, you are probably looking at a risk-off session.

Commodity currencies and oil
Some currencies are tied to what their country exports. The Canadian dollar has a long link with oil, the Australian dollar with metals such as iron ore and copper, and the Norwegian krone with oil and gas. When those commodities move sharply, the currency often follows over days rather than minutes.
Our walkthrough of how to trade oil with price action covers the commodity side.

Where crypto fits in intermarket analysis
Crypto is the clearest example of a correlation that shifts. The IMF found the correlation between daily Bitcoin and S&P 500 returns was 0.01 in 2017–19 but rose to 0.36 in 2020–21. Crypto went from moving largely on its own to trading much more like a risk-on asset.
That relationship can loosen or tighten again, so check it rather than assume it. Within crypto, the share of total value held by Bitcoin is another lens, explained in our guide to bitcoin dominance and what it signals. Cryptoassets are high risk and largely unregulated in the UK for consumer protection, and you could lose all your money.
| Market pair | Typical relationship | When it breaks down |
|---|---|---|
| Gold vs US dollar | Inverse | Panics, when both are bought as havens |
| Stock indices vs Japanese yen | Stocks up, yen down | When Bank of Japan policy drives the yen |
| Stock indices vs Swiss franc | Franc firms in sell-offs | Swiss central bank intervention |
| Crude oil vs Canadian dollar | Move together | When Canadian rates or data dominate |
| Copper vs Australian dollar | Move together | When local interest rates take over |
| Bitcoin vs US stocks | Loosely positive since 2020 | Crypto-specific news, hacks or regulation |
| GBP/USD vs UK–US rate gap | Follows rate expectations | UK political shocks hit sterling alone |
Using intermarket analysis: a worked example
Example: on a £5,000 account, you spot a long setup on gold at a demand zone you marked last week. Before entering, you check that the dollar is falling, stock indices are calm and US yields are easing. The backdrop agrees with the chart, so you take your normal 1% risk of £50.
Now flip it. Same zone, but the dollar is surging after strong US data. The conflict does not cancel the trade, but you might halve the risk to £25 or wait for a stronger trigger, a choice our guide to how much to risk per trade helps you make. The process is the same each time:
- Mark the levels on the market you actually trade.
- List the two or three markets that usually lead it.
- Check whether they agree, conflict or are flat.
- Adjust size or patience, never the stop, based on the answer.

From the desk (December 2017)
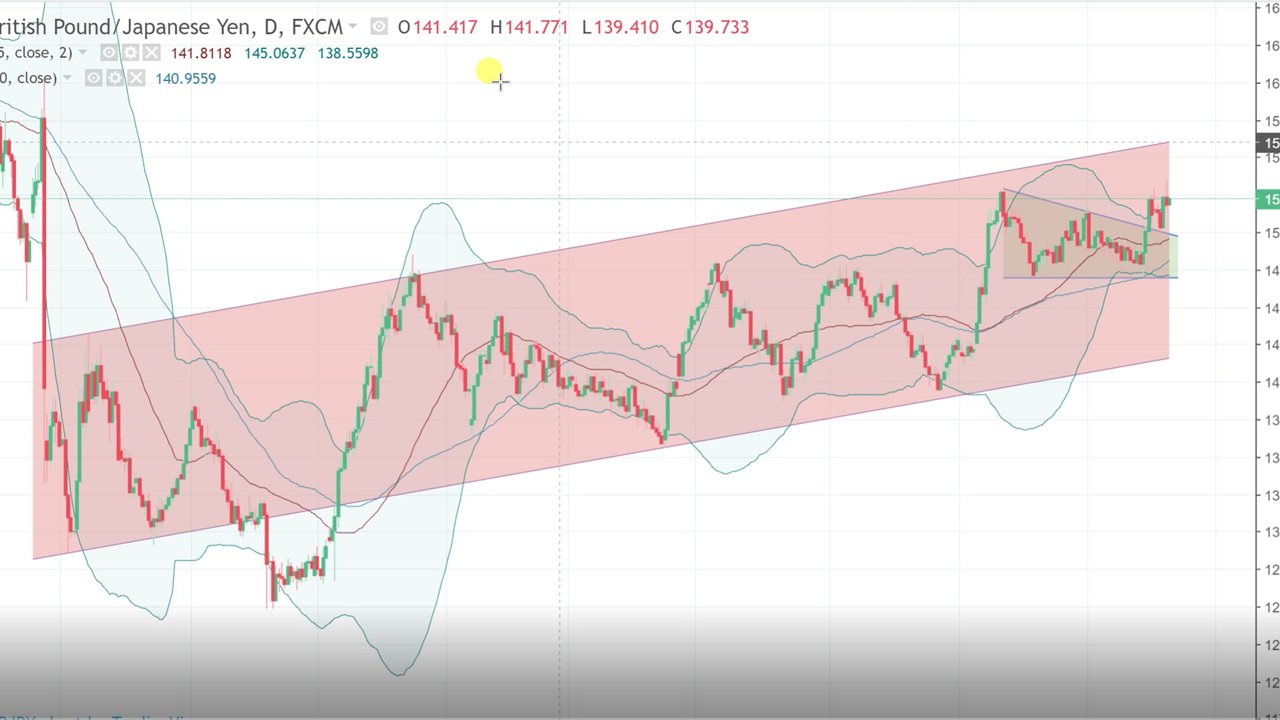
This page began as a short desk note by Nobena in December 2017, recorded alongside a video that is no longer available. It captures three intermarket themes in one line. In Nobena’s words:
“Metals have been falling for weeks, cryptos are at all time highs, and GBP is approaching critical levels.”
Three markets, three separate stories, and the question of how they connect is exactly what this guide is about. It is historical commentary, not a recommendation. For a single-market view of sterling, see our GBPUSD price action strategy.
Common mistakes
- Treating a correlation as a law. Relationships drift and flip; check them before relying on them.
- Measuring on the wrong timeframe. A link that holds over months can be noise on a five-minute chart.
- Doubling risk without noticing. Long gold and long EUR/USD are both bets against the dollar, so one dollar move hits both.
- Ignoring the calendar. Central bank days can override every relationship; know when not to trade and stay flat.
Frequently asked questions
Is gold always inversely correlated with the dollar?
No. The inverse link is a long-run tendency, and in panics both can rise together as havens. Real interest rates often explain gold better than the dollar alone.
What does risk on risk off mean in forex?
It describes whether investors are seeking growth or safety. Risk-on favours equities and currencies like the Australian dollar, while risk-off tends to lift the yen, Swiss franc, gold and often the US dollar.
Is Bitcoin a safe haven like gold?
The evidence so far says it has not behaved like one. IMF research found Bitcoin moved much more in step with stocks from 2020, which is risk-on behaviour rather than haven behaviour.
Do beginners need intermarket analysis to trade price action?
You can trade price action without it, but a quick check of related markets adds useful context. Intermarket analysis for beginners works best as a filter on size and patience, not as a reason to enter.
Next steps
Start with our complete beginner’s guide to price action trading, then add intermarket checks to your routine. If you want a structured path, the free basics section of our trading course covers how we look at markets differently, from building a foundation to trading psychology.
This article is for education only and is not financial advice. Trading leveraged products such as CFDs and spread bets carries a high risk of losing money.