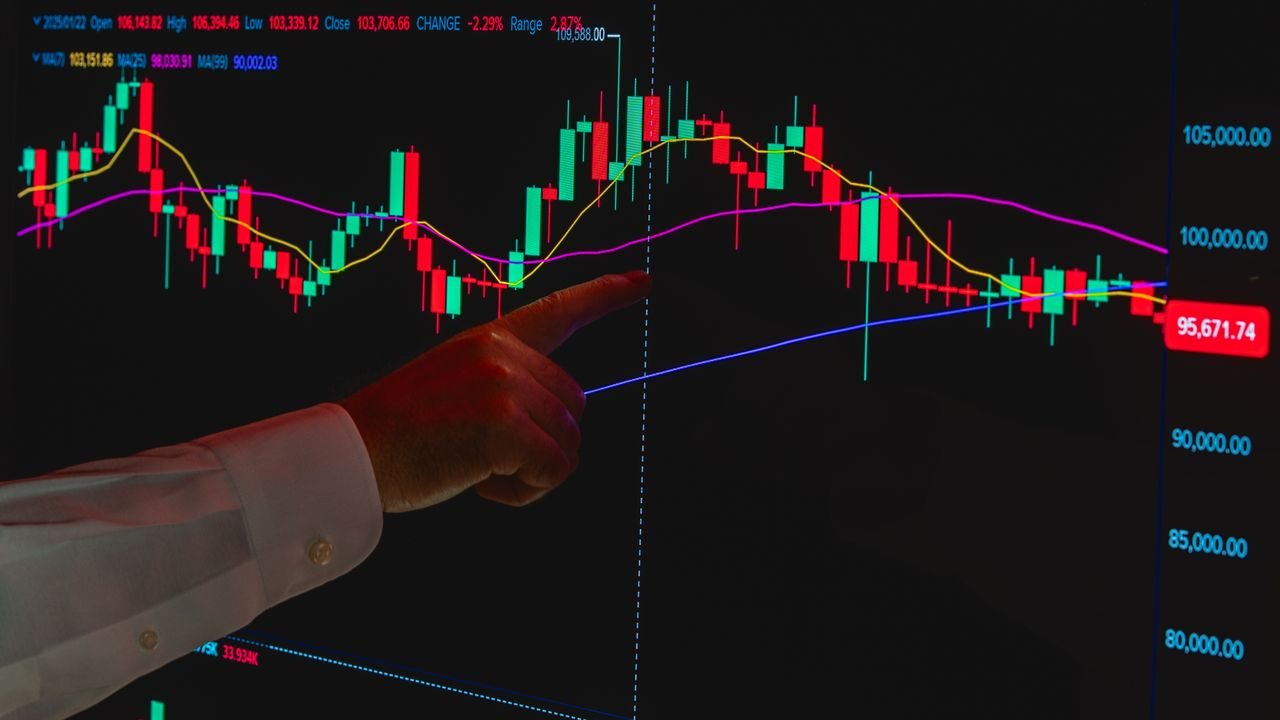

Learning how to trade oil with price action starts with the chart: mark the levels where buyers and sellers have reacted, then wait for price to show its hand at one of them. With oil you also need a calendar, because a few scheduled events move it more than almost anything else on a UK trader’s watchlist.
Quick answer: how do you trade oil with price action?
Pick one contract, Brent or WTI, and mark its weekly and daily support, resistance and supply and demand zones. Check the week’s EIA inventory report and any OPEC+ meeting. Then trade only a clear reaction at a marked level during the busy UK afternoon, with a stop beyond the structure and a small, fixed stake.
Brent vs WTI: which oil are you trading?
Your platform will usually offer two crude contracts, often labelled UK Oil and US Crude. They are related but not identical, and the differences affect when and why each one moves.
| Factor | Brent (UK Oil) | WTI (US Crude) |
|---|---|---|
| Where it comes from | North Sea fields | US inland, priced at Cushing, Oklahoma |
| Main futures exchange | ICE Futures Europe, London | NYMEX (CME Group), New York |
| What it reflects | Global seaborne supply and demand | US supply, storage and demand |
| Most sensitive to | OPEC+, geopolitics, global growth | EIA stocks, US production |
| Price relationship | Usually trades above WTI | Usually trades below Brent |
| Quirk to know | Steadier near expiry | Physical delivery can distort expiry |
That last row matters. In April 2020 the expiring WTI futures contract settled below zero, because holders had nowhere to store the oil. Most spread bets and CFDs roll before expiry, but you should know how your provider handles the roll.
For a beginner we suggest picking one and sticking to it, so your levels and your sense of a normal day build up on the same chart.

What moves oil: inventories, OPEC+ and the calendar
Oil reacts to supply news more sharply than most markets. These are the events we always check before the week starts.
The weekly EIA inventory report
The US Energy Information Administration publishes its Weekly Petroleum Status Report on Wednesdays at 10:30 New York time, which is 15:30 in the UK for most of the year. It covers US crude and fuel stocks, refinery activity, imports and exports.
Holiday weeks move it. When a US federal holiday falls on a Monday, for example, the EIA usually shifts the release back a day, so check its schedule each week. Industry figures from the American Petroleum Institute usually appear the evening before and can move price first.
OPEC+ meetings
OPEC and its allies, together known as OPEC+, meet to set production levels. Their decisions can gap the price, and statements sometimes land at weekends, so Monday can open well away from Friday’s close.

Session timing in UK time
Oil is quoted for nearly 23 hours a day, but the busiest period is the UK afternoon, when New York is active. When the US and UK change their clocks on different dates, in March and around late October, US events arrive an hour earlier for us.
How to trade oil with price action, step by step
The routine below is the same one we use for indices and forex, with the oil calendar added. The full method sits in our guide to what price action trading is.
- Mark the higher-timeframe levels. On the weekly and daily charts, mark the swing highs and lows and the zones where price left sharply, as in how to draw supply and demand zones.
- Check the calendar. Note the EIA release, any OPEC+ meeting and major US data. Decide in advance whether you will be flat through them.
- Decide the bias. Is price trending, ranging or sitting in the middle of nowhere? Middle-of-range trades are where we pass.
- Wait for a reaction at a level. A rejection, a failed break or a breakout that holds on a retest. Our guide to how to avoid false breakouts covers the difference.
- Use your filters. Run the setup through a written checklist, like the one in our filters and triggers trading process, before you commit.

Volatility and leverage risk
Oil can move several per cent in a session, and a surprise inventory figure or OPEC+ headline can jump straight through a stop. That is gap risk, and it means your loss can exceed what you planned.

UK retail rules cap leverage on most commodity CFDs and spread bets, oil included, at 10:1, so a 10% margin. That still lets a small deposit control a large position, and losses are based on the full position, not the margin. Our explainer on margin and leverage for beginners covers how this works.
Worked example: sizing an oil spread bet
Example: on a £5,000 account, risking 1% gives £50 per trade. Brent is at a hypothetical $80.00, and a spread bet quotes it as 8,000 points, with one point equal to one cent.
Price holds a daily demand zone, and a stop beyond the zone is 80 points away. The stake is £50 ÷ 80 = £0.625, rounded down to £0.60 per point, using the method in our guide on how to calculate position size for each trade.
That controls £0.60 × 8,000 = £4,800 of exposure, with margin of about £480 at 10%. If an EIA surprise gaps price 150 points through the stop, the loss would be about £90, not £50. That is why we size for the gap, not just the stop.

From the desk (March 2019)
This post began in March 2019 as Karl’s view on oil. His original paragraph is below as he wrote it, with minor typo fixes. The chart analysis that went with it is not part of this page, and we have not recreated it.
A market often highly discussed is Oil, I’ve participated in a few discussions recently with people who think it’s time to sell Oil. Here is my view and the reason why I’m currently bullish on Oil.
Karl’s older desk note on whether it was a good time to buy oil shows the same habit: form a view from the chart, not from the crowd.
Common mistakes
- Holding a full-size position through the EIA release by accident
- Trading the headline about OPEC+ instead of the reaction on the chart
- Mixing Brent and WTI levels, or switching between them every week
- Sizing by the margin required rather than by the stop distance
- Ignoring contract rolls on futures-based products
Frequently asked questions
Is oil trading good for beginners in the UK?
It can be, provided you start small, because oil teaches you to respect scheduled events and gaps. Its volatility and leverage also make losses fast. We suggest learning the routine on one contract with very small stakes first.
Should I trade Brent or WTI?
Neither is better. Brent reflects global supply and is closer to UK headlines, while WTI reacts more to US inventory data. Pick one and learn how it behaves.
What time is the EIA oil report in UK time?
Normally 15:30 UK time on Wednesdays, and 14:30 during the weeks when the US and UK clocks are out of step. Holiday weeks are usually moved by a day, so check the EIA page each week.
Does price action work on oil?
Price action is a way of reading the chart, not a promise of results. Oil respects clear higher-timeframe levels often enough to be worth studying, but event risk means we also check when not to trade.
Next steps
For other commodities, read our guide to how to trade commodities in the UK and the natural gas price action trading post. For a structured route, the free basics section of our price action trading course covers the foundation, including assessing whether a trade is worth the risk.
This article is for education only and is not financial advice. Trading leveraged products such as CFDs and spread bets carries a high risk of losing money.