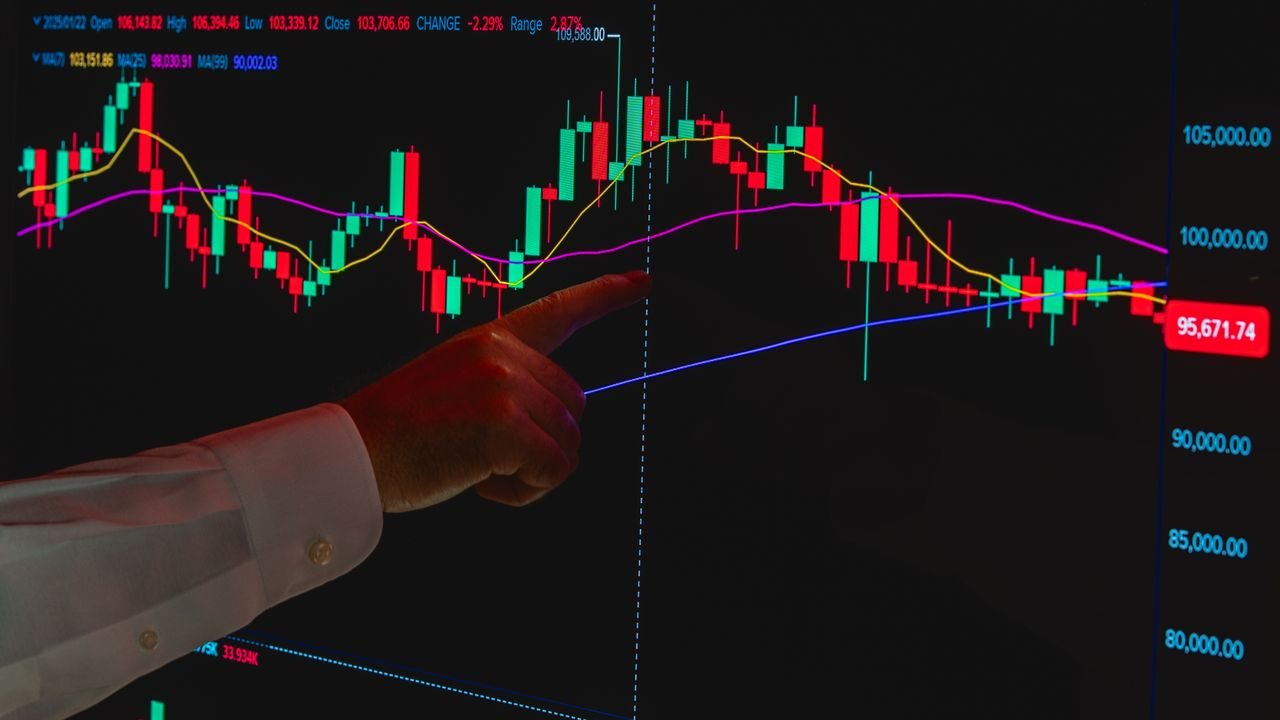

Bitcoin dominance is Bitcoin’s share of the total value of all cryptoassets, shown as a percentage. With bitcoin dominance explained properly, the chart becomes a simple gauge of where money in the crypto market is sitting: in Bitcoin, or spread across everything else. We first posted a dominance chart on this page in March 2020; this guide explains how to read one for yourself.
Quick answer: what is Bitcoin dominance?
Bitcoin dominance (BTC.D) is Bitcoin’s market capitalisation divided by the total crypto market capitalisation, multiplied by 100. A rising figure means Bitcoin’s share is growing; a falling one means other coins, including stablecoins, are growing faster. It describes market share, not direction, so always read it alongside Bitcoin’s own price chart.
What Bitcoin dominance measures
Dominance is a ratio, not a price. It tells you how large Bitcoin is relative to the whole crypto market at a given moment. It says nothing on its own about whether that market is rising or falling.
That distinction is where most beginners go wrong. Dominance can rise while Bitcoin’s price falls, simply because altcoins (every cryptoasset other than Bitcoin) are falling faster. It can fall in a rally if smaller coins are rallying harder.
Traders mostly use it to judge rotation: whether money is concentrating in Bitcoin, which has historically been treated as the less speculative end of crypto, or spreading out into smaller, riskier coins. When that spread is broad and strong, people call it “altcoin season”.

How Bitcoin dominance is calculated
The formula is straightforward. Market capitalisation is the price of a coin multiplied by the number of coins in circulation.
- Take Bitcoin’s market capitalisation.
- Take the combined market capitalisation of all tracked cryptoassets, Bitcoin included.
- Divide the first by the second and multiply by 100.
Example: if Bitcoin were worth a hypothetical £600 billion and the whole market £1,200 billion, dominance would be 50%. If Bitcoin stayed at £600 billion but the rest of the market grew by £300 billion, dominance would fall to 40% without Bitcoin’s price moving at all.
Why websites show different figures
Each data provider tracks a different list of coins and estimates circulating supply in its own way. Some include thousands of tiny tokens; others filter them out. That is why the btc dominance chart on one site rarely matches another exactly, so pick one source and stick with it.
Reading the BTC dominance chart alongside Bitcoin’s price
Dominance is only useful when you pair it with Bitcoin’s own price trend. Four combinations are possible, and each suggests something different about risk appetite. Treat these as descriptions of what the market is doing, never as forecasts.
| Bitcoin price | Dominance | What it usually suggests |
|---|---|---|
| Rising | Rising | Money favouring Bitcoin over altcoins |
| Rising | Falling | Altcoins rising faster: broad risk appetite |
| Falling | Rising | Altcoins falling harder: retreat to Bitcoin or out |
| Falling | Falling | Broad sell-off; check whether stablecoins are growing |
To judge Bitcoin’s direction, use the same structure you would on any market: higher highs and higher lows for an uptrend, lower highs and lower lows for a downtrend. Our guide on how to read price action on a clean chart covers this, and spotting the start of a new trend helps when structure is changing. Our guide to price action trading crypto covers this step by step.

Altcoin season and dominance
Altcoin season is the informal name for a period when a wide range of smaller coins outperform Bitcoin. On the dominance chart it shows up as a sustained fall while Bitcoin’s price holds or rises. Commentators often quote fixed dominance levels as “triggers”, but there is no level that reliably starts or ends one.
If you trade a single altcoin, check its own chart and its chart against Bitcoin before reading anything into dominance. Our older desk post on why Ripple lagged the crypto market shows how one coin can go its own way.
How stablecoins distort Bitcoin dominance
Stablecoins are tokens designed to hold a fixed value, usually one US dollar. They count towards total crypto market capitalisation, so they affect dominance even though nobody is speculating on their price.
Example: suppose a hypothetical market of £1,000 billion is made up of £550 billion in Bitcoin, £350 billion in altcoins and £100 billion in stablecoins, giving 55% dominance. New money then arrives as £100 billion of fresh stablecoins and simply waits on the sidelines. The total becomes £1,100 billion and dominance falls to 50%, even though no altcoin has moved.
This is why a falling dominance line during a downtrend is not a sign of altcoin strength. Some traders build a version that excludes stablecoins to get a cleaner read of speculative rotation.

Limits of Bitcoin dominance as an indicator
Dominance is a context tool. We use it to understand the backdrop, then make decisions from price action on the market we actually trade.
- It has no direction: it shows share, not whether the market is worth being in.
- Composition changes: new tokens and stablecoin growth shift the denominator.
- It often mirrors Ether: as the second-largest coin, Ether’s moves against Bitcoin can drive much of the change.
- Short samples: crypto has only a few market cycles of history, so past dominance patterns are thin evidence.
For a wider view of the market behind the number, see our overview of the crypto asset market and how it is structured, and our companion piece on Bitcoin market cycles and the long-term trend.

Risk: crypto is not a regulated safety net
Cryptoassets are high risk. The FCA’s consumer guidance on cryptoassets says crypto is largely unregulated in the UK and that you should be prepared to lose all the money you invest. It also says Financial Services Compensation Scheme cover is highly unlikely if things go wrong.
Prices can fall very sharply, and leverage multiplies losses as well as gains. Size every position with a fixed risk per trade you can afford to lose, and keep coins you hold secure using our guide to protecting your digital assets from theft and loss.

Common mistakes
- Reading a falling dominance line as bullish for all altcoins.
- Ignoring the stablecoin share during sell-offs.
- Comparing dominance figures from different providers.
- Treating a dominance “level” as a trade trigger.
- Skipping the price chart of the coin you actually trade.
The fix is the same in each case: dominance sets context, price action on your own market decides the trade, and risk is fixed before entry. It is worth also reading our view on whether Bitcoin is a bubble for the bigger valuation debate.
Frequently asked questions
What does it mean when Bitcoin dominance goes up?
Bitcoin’s share of total crypto value is growing. That can happen because Bitcoin is rising faster than altcoins or because altcoins are falling faster than Bitcoin, so check the price chart to tell which.
Does falling Bitcoin dominance mean altcoin season?
Not on its own. Dominance can fall because altcoins are rallying, but it can also fall because stablecoins are growing during a sell-off. Look for Bitcoin’s price holding or rising while dominance falls.
How do stablecoins affect Bitcoin dominance?
Stablecoins count in total crypto market capitalisation. When their supply grows, the denominator grows and dominance falls even if no other coin has moved, which can give a misleading picture of rotation.
Is Bitcoin dominance a reliable trading indicator?
It is useful context but not a trigger. With bitcoin dominance explained as market share, it is clear it cannot tell you direction, and its history covers only a few cycles.
Next steps
Build the method behind reading any chart in our price action trading guide for beginners, then set your limits with our rules-based trading risk management model. When you want a structured path, the free basics section of our price action trading course starts with how to look at markets differently.
This article is for education only and is not financial advice. Trading leveraged products such as CFDs and spread bets carries a high risk of losing money.