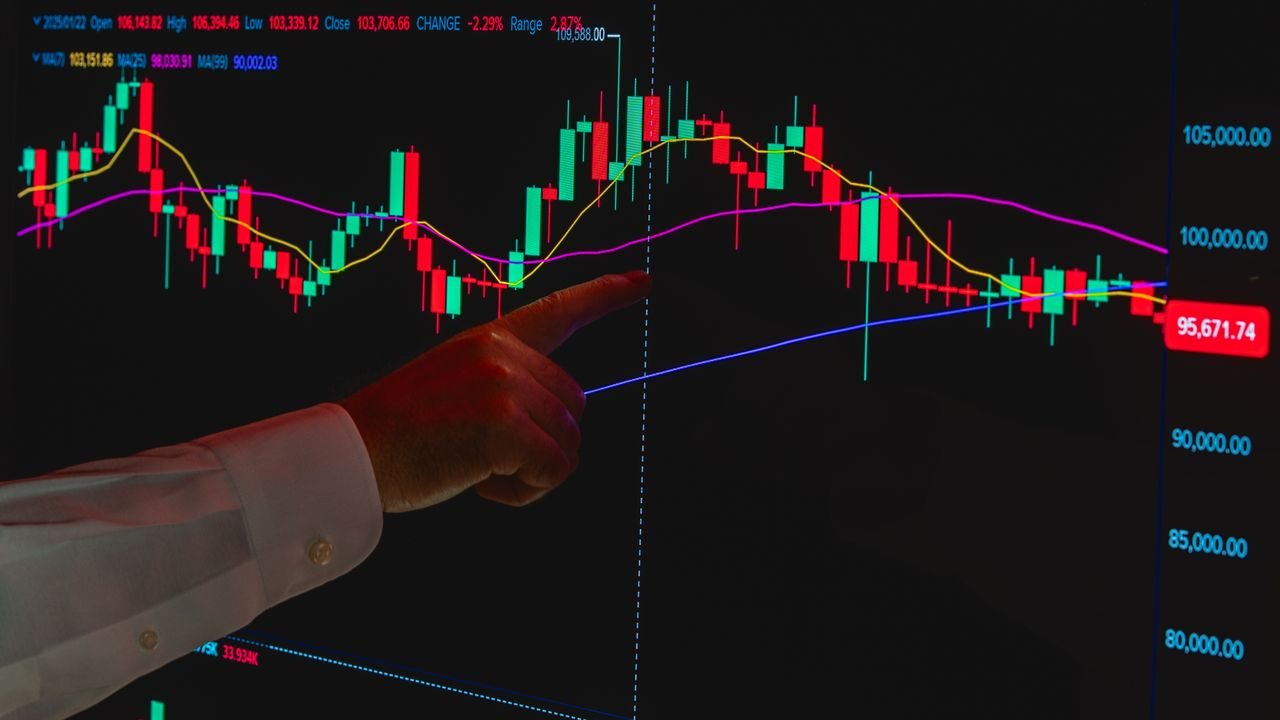

A GBPUSD price action strategy starts with three questions: where are the levels that matter, which session are we in, and what news is due? Answer those before you look for a candle pattern and cable becomes far easier to read. This page sets out the routine we use, with a dated example from our desk.
Quick answer: what is a simple GBPUSD price action strategy?
Mark the previous day’s high and low and the main higher-timeframe zones before London opens. Note any UK or US data due that day. Then trade only the reaction at those levels during the London session or the London/New York overlap, with a stop beyond the zone and a size set per pip.
Why GBP/USD is called cable, and how it behaves
GBP/USD is the pound against the US dollar. The nickname “cable” dates from the 1800s, when the exchange rate was sent between London and New York by transatlantic telegraph cable. Cable trading is popular with UK traders because the pair moves most during UK hours.
Cable tends to cover a wider daily range than EUR/USD and to overshoot obvious levels before deciding on direction. EUR/USD is usually the steadier, more liquid pair, while sterling reacts sharply to UK news and politics. In practice, cable needs slightly wider zones and more patience after a break.
Sessions: when cable moves
If you want to know how to trade GBPUSD efficiently, the clock matters as much as the chart. Different sessions produce different behaviour.
| Session | UK time | Typical behaviour |
|---|---|---|
| Asia | Midnight to 7am | Narrow range, builds overnight highs and lows |
| London open | 7am to 10am | Volume arrives, overnight range often tested or swept |
| UK data | Usually 7am or 9:30am | Sharp spikes on CPI, GDP and jobs figures |
| London/New York overlap | About 1pm to 5pm | Deepest liquidity, US data at 1:30pm |
| Late US | 5pm to 10pm | Fading volume, except on Fed days |
The London open
The first hours of London often push through the Asian high or low, then either carry on or reverse. A quick run beyond an overnight extreme that fails and closes back inside the range is one of the more readable cable patterns. We treat it as a filter and trigger for a trade entry, not a trade on its own.
The London/New York overlap
From about 1pm UK time both centres are active, and US releases such as non-farm payrolls and inflation land at 1:30pm. Moves here can be the day’s largest. They can also reverse the London trend completely.

UK and US data that moves GBP/USD
Cable is driven by two central banks and two sets of data. Keep these on your calendar every week.
- Bank of England decisions: the Monetary Policy Committee meets eight times a year. The Bank of England’s MPC dates page lists each announcement in advance.
- Federal Reserve decisions: the FOMC also holds eight scheduled meetings a year, listed on the Federal Reserve’s FOMC calendar. Decisions land in the UK evening.
- UK releases: inflation (CPI), GDP, the labour market and retail sales.
- US releases: non-farm payrolls, CPI and retail sales.
We rarely open a new position in the minutes before these releases. Spreads widen and stops can fill badly, which is why our guide on conditions when we stay flat lists major data as a reason to wait.
After a release, we let the first spike settle and then judge the reaction at our marked levels. A clean hold or rejection after the news is often more useful than any guess made before it.
A GBPUSD price action strategy around key levels
Our approach follows the same steps as our guide on how to read price action step by step, tuned for cable.
- Daily chart: mark the trend and the main supply and demand zones on the higher timeframe.
- Key levels: add the previous day’s high and low, the Asian range and nearby round numbers.
- Calendar: note the release times and avoid them.
- Reaction: on the 15-minute or one-hour chart, wait for a sweep and rejection, or a clean break and retest.
- Location: ask whether there is room to the next level. Our article on whether a trade is worth the risk covers this.

Sweeps, breaks and retests
Cable often runs a little beyond an obvious high or low before reversing. That behaviour punishes tight stops and early entries. When a level does break with conviction, we prefer the retest to the first candle, as explained in our guide to trading breakouts and retests.
Sizing per pip: a worked example
A pip on GBP/USD is the fourth decimal place. In a UK spread bet you stake £ per point, so each pip is worth your stake; on a CFD, one standard lot is worth about $10 per pip.
Example: on a hypothetical £5,000 account risking 1%, the maximum loss is £50. With a 25-pip stop beyond the zone, the stake is £2 per point. If the zone needs 40 pips, the stake falls to £1.25 per point, so the risk stays the same.

Our guide to calculating position size for a spread bet walks through the formula. Spread bets and CFDs are leveraged, so a move against you can cost far more than your margin.
From the desk (March 2020)
This page started life as a short trade write-up by Karl in March 2020, a very volatile month across markets. His original notes are kept below as a historical example, not a recommendation. In his words:
Today’s trade, giving you all an insight into why I took the trade!
Technical breakdown, any questions feel free to ask!
For more historical desk views on sterling, see our September 2017 post asking how much higher the pound could go and our January 2018 preview of the big week ahead for JPY, EUR, USD and GBP.
Common mistakes with cable
- Entering on the first touch of a level, then being stopped out by the sweep.
- Holding a fresh position through BoE, CPI or payrolls releases.
- Copying EUR/USD stop sizes onto a pair that ranges further.
- Trading the quiet late-US session out of boredom.
- Raising the stake after a loss. Our article on how to stop emotional trading deals with this.
Frequently asked questions
What is the best time to trade GBP/USD?
For most UK traders it is the London session, from about 7am, and the London/New York overlap from about 1pm to 5pm. Liquidity is deepest then, and spreads are usually tightest.
Is GBP/USD more volatile than EUR/USD?
Cable usually covers a wider daily range than EUR/USD and reacts more sharply to UK news. That means wider stops and a smaller size for the same risk.
How much is a pip worth on GBP/USD?
In a spread bet, a pip is worth whatever you stake per point. On a CFD, one standard lot is roughly $10 per pip, converted into pounds by your broker.
Can you trade GBP/USD without indicators?
Yes. Levels, sessions and candle reactions are enough for a complete method. Many traders add volume or a moving average, but neither is required.
Next steps
Start with our complete beginner’s guide to price action and our guide to trading forex in simple steps. When you want the full process, the free basics section of The Two Traders price action course is a good place to begin.
This article is for education only and is not financial advice. Trading leveraged products such as CFDs and spread bets carries a high risk of losing money.