- October 18, 2017
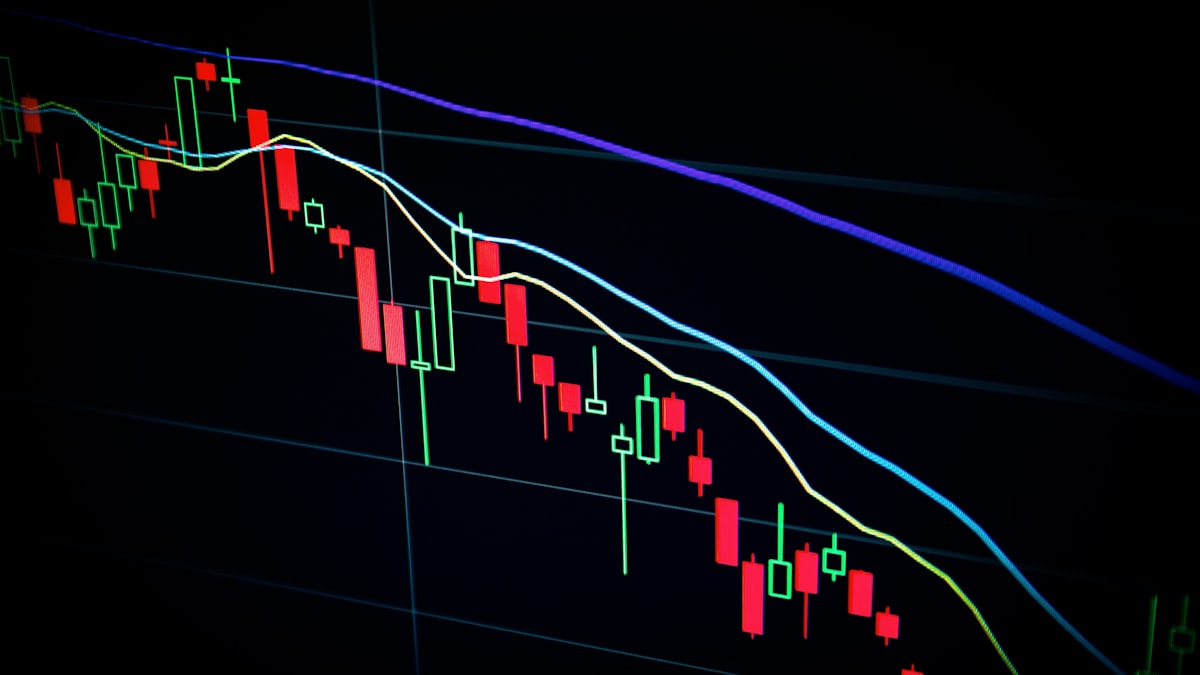
Technical indicators are used to try and predict market trends. Simply put, a technical indicator is a calculation made using historical price data that can indicate the future direction of a financial instrument and give insights into current market conditions.
It is difficult to gauge directly from the chart data what the market is really doing, so technical indicators aim to filter out of a lot of the noise of price action. This gives you a much clearer view of what is really going on and results in better decision making.
Indicators
Moving Averages
Moving averages are the arguably the most straightforward technical indicator. This indicator calculates the average close price over a given time period, for example a 50 day simple moving average would average the close price for each day over 50 days. Other types of moving averages include exponential and weighted moving averages, which account for more recent prices more significantly. They are therefore more responsive and track the price more closely than a simple type. Moving averages are often used in exit strategies , trend filters , and as a basis for calculating other indicators, such as Bollinger bands. By varying the length of a moving average you can completely change an entire strategy, from one of capturing short term momentum to longer term trends. It is therefore crucial to understand these as they form the basis of many strategies
Bollinger Bands
The Bollinger Band is an extremely useful indicator that creates a price range using standard deviations (SD) of the closing prices and a moving average over a given time period. The price range is often set 2 standard deviations above and below the current moving average price. Where the example below shows the use of a 50 day simple moving average and +/- 2 SD. The Bollinger Band is used to highlight consolidating price actions and when price breakouts occur.
A Bollinger band breakout is my favourite pattern to play. It signifies the market is moving to extreme levels and can be used to either go with the momentum (like my $7000 Ethereum profit & $1400 EURGBP profit ). Alternatively you can use it to predict when the market is going to pullback (like my $1700 Natgas profit & $1700 GBPJPY profit ).
Donchian Channel
Similar to Bollinger Bands, Donchian Channels also create a price range within which most ‘normal’ market action will remain. However, the price range of a Donchian Channel is formed by using historical maximum and minimum prices over a given time period and when a new high or low is made, the line adjusts to this new level. The diagram below demonstrates how the price range is redrawn every time a new max. or min. price is reached . As a result, it essentially keeps track of recently highs or lows that are likely to be resistance levels. The longer the time frame, the more significant the resistance/support , as people will anchor to this more strongly. Similarly to the Bollinger Band, the Donchian Channel is used to highlight consolidating price action and when price breakouts occur.
This was the main indicator used by the legendary ‘Turtle Traders’, who made $175 million in 5 years . The basic strategy was to buy when the market moved above the top of the 20 day Donchian channel (20 day high) and sell when it below the bottom of the 20 day Donchian Channel (20 day low). The exit would a 10 day high/low in the opposite direction.
Average True Range (ATR)
Unlike most technical indicators, Average True Range, or ATR, is an indicator that measures volatility rather than price direction. ATR calculates a value based on how “spikey” the price action is on the charts, with “spikey” signalling how high or low the price is in a given time period, versus what is common to that market. A higher ATR means a more volatile market and a lower ATR means a less volatile market – this can be used to scale your position sizing, as I explain here
Fibonacci Lines
Fibonacci Lines, based on the Fibonacci sequence, are used to trade through Fibonacci retracement. The retracement levels are formed by drawing a line from the recent low to the recent high (As shown below). Trades are placed with trend when the price “retraces” back to either the 61.8%, 50% or 38.2% levels. When the market reaches one these levels, traders can try and make a low risk entry with of the initial trend. Simply put, traders using this strategy anticipate that price has a high probability of bouncing from the Fibonacci levels back in the direction of the initial trend.
I don’t personally use Fibonacci levels to make decisions, as I find they are more subjective than other indicators. However, you will find that markets regularly respond to these areas, as Fibonacci Lines are commonly used by other traders.
Relative Strength Index (RSI)
Relative Strength Index, or RSI, is a momentum indicator. It provides information as to whether a financial instrument is overbought or oversold. The range is between 100 – 0: a market is said to be overbought above 70, and oversold below 30. A divergence between RSI and price (i.e. they move in the opposite directions) can signify a future reversal in price action. You can use these in conjunction with other indicators to give a better indication of the trend and give entry points.
There is no perfect indicator that guarantees profitability all the time. Each of the above has different advantages and you can use them in different ways. The key is to understand how to use them and to apply them consistently to give you a trading edge. Learn to effectively trade with technical indicators , and you greatly increase your chances of success.
The Two Traders
Start trading now or visit the Get The Trading Edge tab for more free content
Share this:
- Click to share on Twitter (Opens in new window)
- Click to share on Facebook (Opens in new window)
- Click to share on Google+ (Opens in new window)