This guide covers how to read candlestick charts for beginners, one candle at a time. Each candle shows where price opened, how high and low it travelled and where it closed over a set period. Once you can read those four prices, the named patterns make sense, and you can see why where a candle forms matters more than its shape.
Quick answer: how do you read a candlestick?
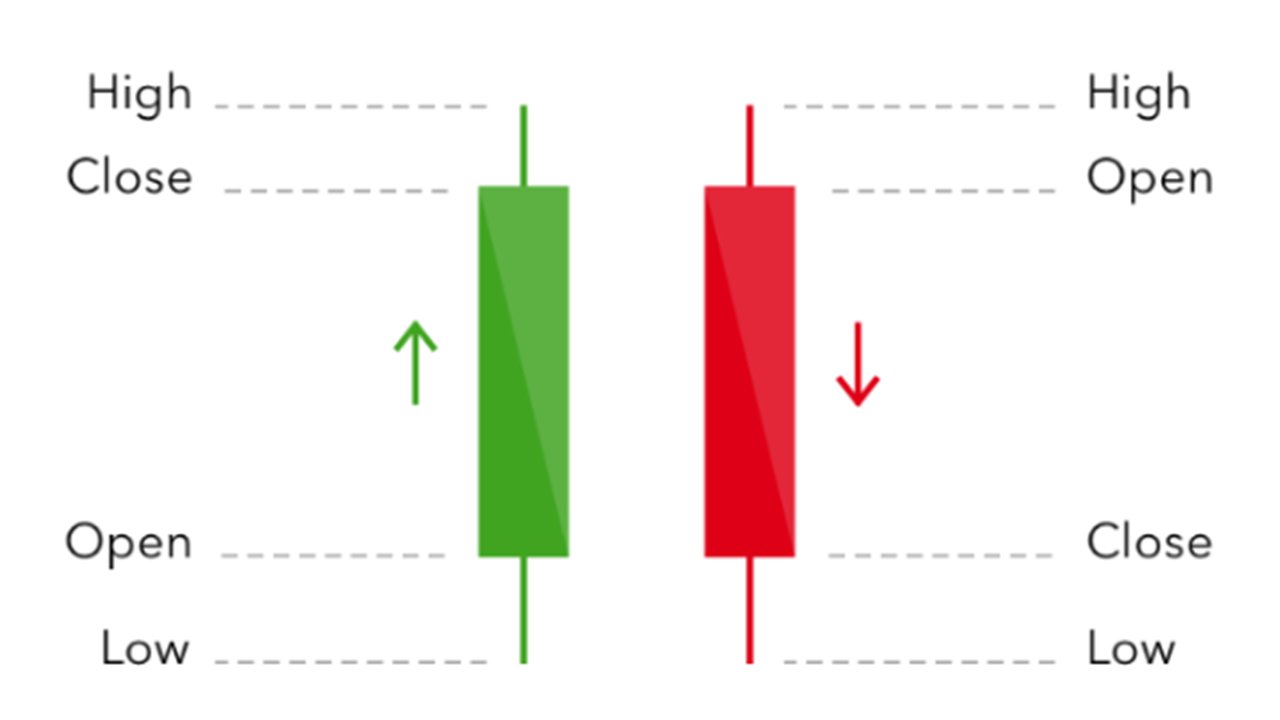
Each candle covers one period. The body runs from the open to the close: green (or hollow) if price closed higher, red (or filled) if it closed lower. The thin wicks above and below mark the high and low. Read the body for who won the period, and the wicks for where price was rejected.
What are candlesticks in trading?
Are you new to Forex trading and not sure what the red and green candlesticks mean? Don’t worry we are here to help you understand!
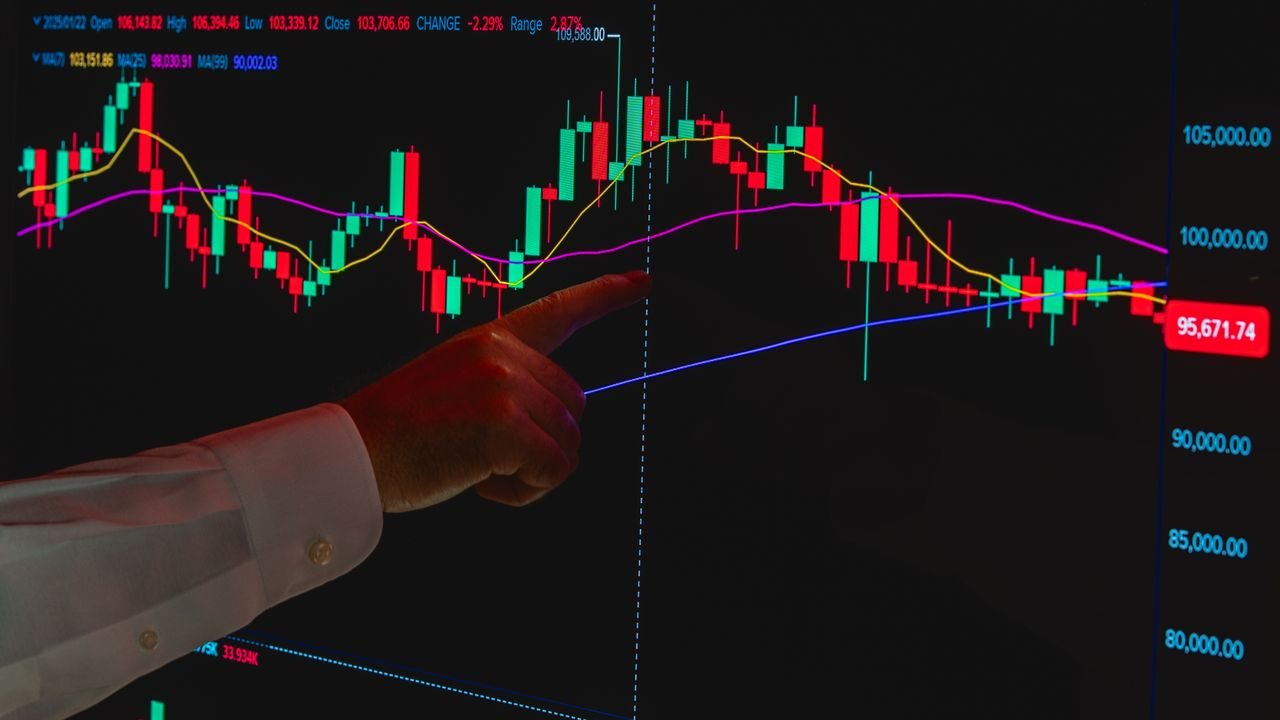
The red and green blocks you see on a chart are called candlesticks, they’re basically a receipt for the day’s trading, every single tick throughout the day is recorded.
Watch this short video to help you understand further, once you’ve finished take the TEST.
The original quiz is no longer on the site, so the questions at the end of this guide now serve as your test. Karl’s receipt idea is the right starting point: a daily candle sums up a whole day of trading in one shape, and the same is true of an hourly or weekly candle for its own period.
The anatomy of a candle
Every candle is built from four prices, often shortened to OHLC: the open, high, low and close of the period. The candle draws them in two parts.
- Body: the thick part between the open and the close. A long body means one side controlled the period.
- Upper wick: the thin line above the body, reaching the period’s high.
- Lower wick: the thin line below the body, reaching the period’s low. Wicks are also called shadows.

A candle is not final until it closes
While the period is still open, the candle keeps changing. A candle that looks like a strong rejection at 10:40 can finish the hour as an ordinary bar. We only read a candle once it has closed.
Timeframe changes the story
One daily candle contains 24 hourly candles. A messy run of hourly bars can add up to a single clean daily pin bar, so always note which timeframe you are reading.
Bullish vs bearish candles
A bullish candle closed higher than it opened, so buyers won the period. A bearish candle closed lower than it opened, so sellers won. Most platforms colour them green and red, but some use hollow and filled or white and black, and you can usually change the colours yourself.
The colour alone tells you little. A small green candle with a long upper wick shows buyers pushed up, then lost most of the ground. That is weaker than its colour suggests.

Four candlestick patterns worth learning first
There are dozens of named candlestick patterns, but beginners only need a few single-candle and two-candle signals to start reading charts well.
Pin bar
A small body at one end with a long wick at the other, at least twice the body’s length. A long lower wick shows sellers pushed price down and were firmly rejected; a long upper wick shows the opposite. At the bottom of a fall this shape is often called a hammer candlestick pattern.
Engulfing candle
A candle whose body fully covers the previous candle’s body, in the opposite direction. It shows control switching from one side to the other within a single period. Our engulfing candle strategy shows how to trade one at support and resistance.
Doji
A candle where the open and close are almost the same, leaving a tiny body. It shows indecision: neither side won. After a long move into a level, that pause can matter. Our doji candlestick pattern guide covers the different types and how to trade them.
Inside bar
A candle whose whole range sits inside the previous candle’s range. It shows the market contracting and waiting, and a break of the larger candle’s high or low often shows which side takes over.

Why location matters more than the pattern
A pin bar in the middle of a range is usually noise. The same pin bar at a level where price turned sharply before is the market telling you something. A 31-year study of chart patterns by Lo, Mamaysky and Wang found that several patterns carry some extra information and may have some practical value. That is a modest finding, which is why we judge every pattern by where it forms.
Both of those happen at levels. That is why we mark supply and demand zones on the chart before looking at any candle, and then ask whether price is in a position worth the risk.
| Pattern | What it shows | Where it matters |
|---|---|---|
| Pin bar | Price rejected from one side | At a tested support or resistance zone |
| Engulfing | Control switching sides | At a zone, after a clear move into it |
| Doji | Indecision, a pause | After an extended move into a level |
| Inside bar | Contraction before expansion | At a level or in a trend pullback |
| Any of them | Very little | Mid-range, away from levels |
How to read candlestick charts for beginners: a worked example
When we look at a fresh chart, we read candles in the same order every time:
- Note the timeframe and confirm the candle has closed.
- Find the trend on a higher timeframe and the nearest level.
- Read the body: who won the period, and by how much?
- Read the wicks: where was price rejected?
- Decide whether the candle is a trigger at a level, or just noise.

Example, using hypothetical figures: on a £5,000 account, the daily trend is up and price falls back into a support zone. A 4-hour pin bar closes there, its lower wick poking below the zone and its body closing back inside it.
The trader enters above the pin bar’s high with a stop 25 points below the wick, risking 1%, or £50. That works out at £2 a point on a spread bet. Spread bets are leveraged, so a gap through the stop can cost more than planned; the full sizing method is in our guide on deciding how much to risk per trade.
Common mistakes beginners make
- Memorising pattern names instead of asking what buyers and sellers did in the period.
- Acting before the close. Half-formed candles change shape.
- Trading patterns away from levels, where they carry little meaning.
- Ignoring the higher timeframe, so a bullish candle is bought straight into a falling market.
- Treating one candle as the whole reason to trade. In our price action entry checklist of filters and triggers, a candle is the trigger, not the filter.

Candles also help you spot when a trend is changing, as bodies shrink and wicks grow against the move. Our steps for identifying a new trend early from price action build on exactly that.
Frequently asked questions
What do red and green candles mean?
A green candle closed higher than it opened, so buyers won that period. A red candle closed lower than it opened, so sellers won. Some platforms use other colours, but the logic is the same.
What does a long wick mean?
It shows price travelled to that point during the period and was pushed back before the close. A long lower wick at support suggests buyers rejected lower prices.
Are candlestick patterns reliable?
Not on their own. A pattern in the middle of a range is mostly noise; the same pattern at a tested level, in line with the higher-timeframe trend, is worth paying attention to.
Which timeframe should beginners use?
Start with daily and 4-hour candles. They form slowly, give you time to think and filter out much of the noise found on very short timeframes.
Next steps
Candles are the alphabet of the chart. Our guide on reading price action step by step shows how they fit into a full analysis, and the complete beginner’s guide to price action trading covers the wider method.
For a structured path, the free basics section of our price action trading course for beginners starts with exactly these foundations.
This article is for education only and is not financial advice. Trading leveraged products such as CFDs and spread bets carries a high risk of losing money.