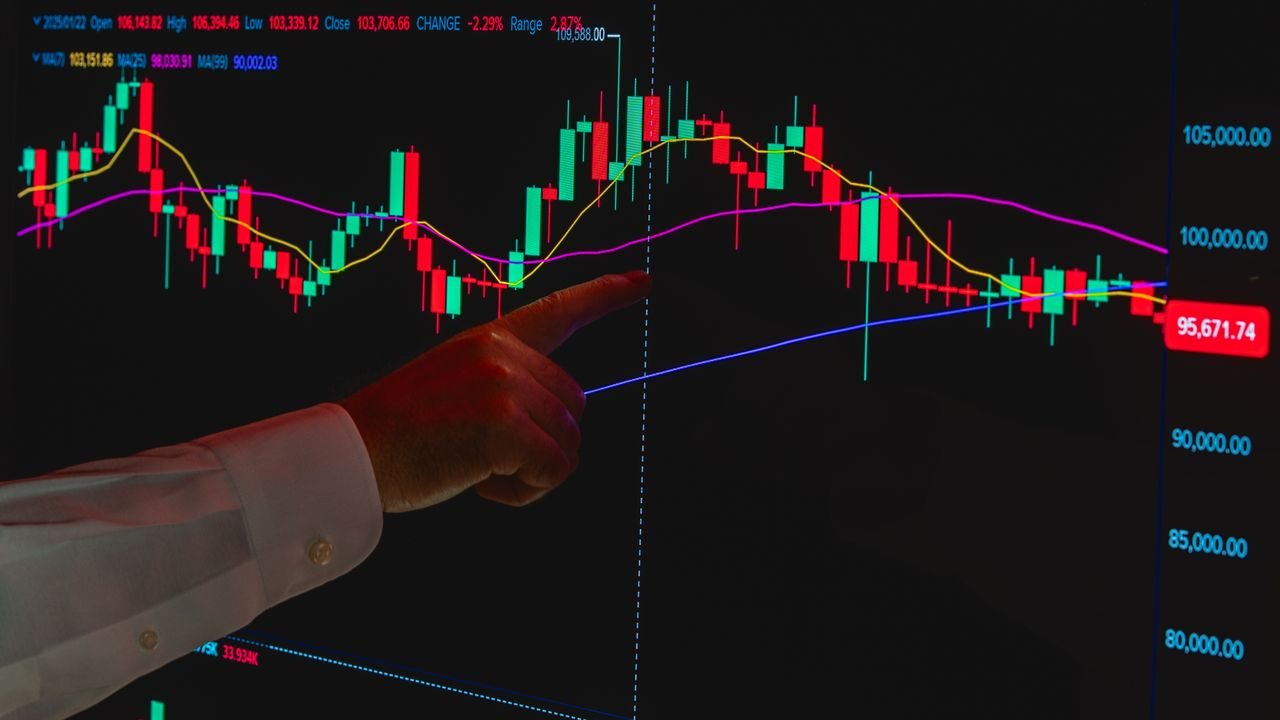
The dark cloud cover pattern is a two-candle bearish reversal: after a rise, a strong bullish candle is followed by a bearish candle that opens above it and closes below the midpoint of its body. Its bullish mirror, the piercing line, does the same after a fall. Both show one side losing control within a session, and both matter most at a level marked in advance.
Quick answer: what is the dark cloud cover pattern?
Dark cloud cover is a bearish two-candle pattern after a rise. The first candle is a strong bullish one. The second opens above its close and closes below the midpoint of the first candle’s body, but above its open. The piercing line is the bullish mirror after a fall.
What the dark cloud cover pattern looks like
If bodies and wicks are new to you, start with how to read candlestick charts for beginners. A valid dark cloud cover has four parts:
- A rise before it, so there is something to reverse.
- A strong bullish first candle with a large real body (the part between open and close).
- A second candle that opens higher, above the first candle’s close.
- A bearish close below the midpoint of the first candle’s body, but still above that candle’s open.
The midpoint is measured on the real body, not on the full high-to-low range. If the first candle opened at 100 and closed at 120, the midpoint is 110, and the second candle must close below 110 to qualify.
The piercing line: the bullish mirror
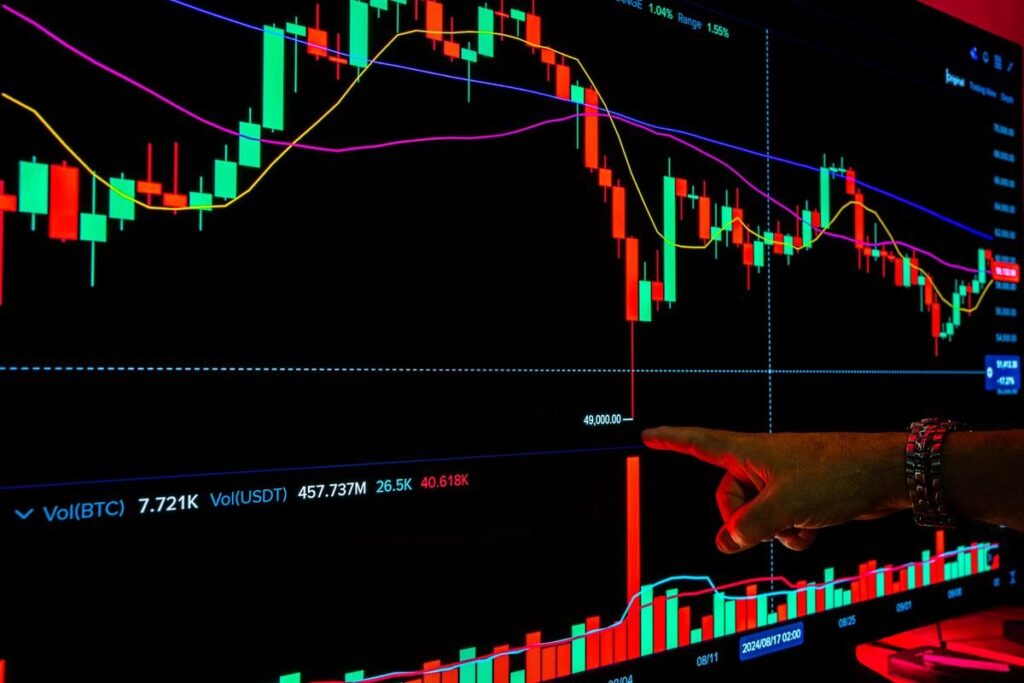
The piercing line follows the same rules upside down. After a fall, a strong bearish candle is followed by a bullish candle that opens below its close and then closes above the midpoint of its body, but below its open.

The story is a failed push lower. Sellers open the second session weaker, buyers take over and recover more than half of the previous candle’s losses. If that happens at a demand zone or support level, it is worth watching for a break higher.
Gaps and the 24-hour market problem
The classic definition has the second candle opening beyond the first candle’s high (dark cloud) or low (piercing line), which needs a gap. That happens on stock and index charts at the open, a topic covered in our gap trading strategy for price gaps.
In forex, which trades around the clock, the next candle usually opens at the previous close. Most traders accept a relaxed rule there: the second candle opens at or near the prior close, and the midpoint rule does the real work. We use the relaxed version but treat it as slightly weaker evidence.
Dark cloud cover vs engulfing, harami and morning star
It helps to see these patterns on one scale of how far the second candle reaches into the first. A harami stays inside the first body, as our guide to the harami candlestick pattern and its inside candle shows. A dark cloud cover or piercing line closes past the midpoint. If the close goes beyond the first candle’s open, the pattern becomes an engulfing candle, covered in our engulfing candle strategy at support and resistance.
| Pattern | Candles | Second candle’s close | Strength of shift |
|---|---|---|---|
| Harami | Two | Inside the first body | Hesitation |
| Dark cloud or piercing line | Two | Past the first body’s midpoint | Clear shift |
| Engulfing | Two | Past the first body’s open | Full reversal of the session |
| Evening or morning star | Three | Third candle closes deep into the first | Slower, staged turn |
The three-candle versions spread the same turn over an extra session, with a small middle candle showing indecision. Our guide to the morning star and evening star patterns explains them.
Where the pattern matters, and the evidence
A dark cloud cover in the middle of a range tells you very little. We look for it only where sellers had a reason to appear, and for the piercing line where buyers did:
- At a supply or demand zone drawn with our method for how to draw and trade supply and demand zones.
- At a previous swing high or low that has turned price before.
- After an extended run, where the trend may be tiring.
- On the 4-hour or daily chart, where each candle reflects meaningful trading.
Be wary of anyone quoting a success rate. The best-known academic test of chart patterns, an NBER working paper by Lo, Mamaysky and Wang, found that several classical patterns carried some extra information in US stocks from 1962 to 1996. It did not test two-candle patterns like this one, so we treat the dark cloud cover as a clue, not an edge.

How to trade a dark cloud cover or piercing line
- Location: the pattern forms at a level you marked before it appeared.
- Trigger: for a dark cloud cover, wait for a later candle to break below the second candle’s low; for a piercing line, above its high.
- Stop: a buffer beyond the pattern’s extreme. Our guide to where to place a stop loss with price action explains how wide.
- Target: the next opposing level, at least twice the stop distance away, or we skip it.
- Size: set the stake from the stop distance using how to calculate position size for forex, CFDs and spread bets.

Worked example: a dark cloud cover at index resistance
All figures are hypothetical. On a £10,000 account we risk 1% per trade, which is £100. A stock index has rallied into daily resistance near 7,800.
- First candle: bullish, opening at 7,700 and closing at 7,800, with a high of 7,810. The body is 100 points, so its midpoint is 7,750.
- Second candle: opens at 7,815, reaches 7,830, then closes at 7,735 with a low of 7,725. That close is below 7,750 but above 7,700, so the pattern is valid.
- Trigger: the next session trades below 7,725, so we sell at 7,720.
- Stop: 7,840, above the high with a buffer, which is 120 points away. £100 divided by 120 points is about £0.83 per point, so we round down to £0.80 and risk £96.
- Target: support at 7,480, 240 points away, so the potential gain is about £192, twice the risk.
If price rallies through 7,840, we lose about £96 plus the spread. Spread bets and CFDs are leveraged, so a gap through the stop could make the loss larger than planned.
Common mistakes
- Measuring the midpoint on the full range. The rule uses the real body.
- Calling a shallow close a dark cloud. A close above the midpoint is closer to a harami.
- Trading it mid-range. Without a level behind it, the pattern carries little weight.
- Fighting a strong trend. One bearish session in a powerful rally is often just a pause.
Frequently asked questions
Is dark cloud cover bullish or bearish?
It is bearish. It forms after a rise and shows sellers taking back more than half of the previous bullish candle’s body.
What is the difference between dark cloud cover and bearish engulfing?
Both open above the prior candle. Dark cloud cover closes between the midpoint and the open of the first body, while a bearish engulfing candle closes below that open.
Does the second candle have to gap?
In the classic definition, yes. In 24-hour markets such as forex, most traders accept an open at or near the prior close and rely on the midpoint rule.
How is a piercing line confirmed?
We wait for a later candle to break above the piercing candle’s high. That costs a little price but filters out many failed turns.
Next steps
Two-candle patterns work best inside a wider reading of the chart, which our complete beginner’s guide to price action trading builds step by step. For another two-candle reversal, see our guide to tweezer tops and bottoms with matching highs and lows, and for a single-candle top, the shooting star candlestick pattern.
Supply and demand, and a filters and trigger process for entries, are both part of our price action trading course, and the basics section is free to start.
This article is for education only and is not financial advice. Trading leveraged products such as CFDs and spread bets carries a high risk of losing money.