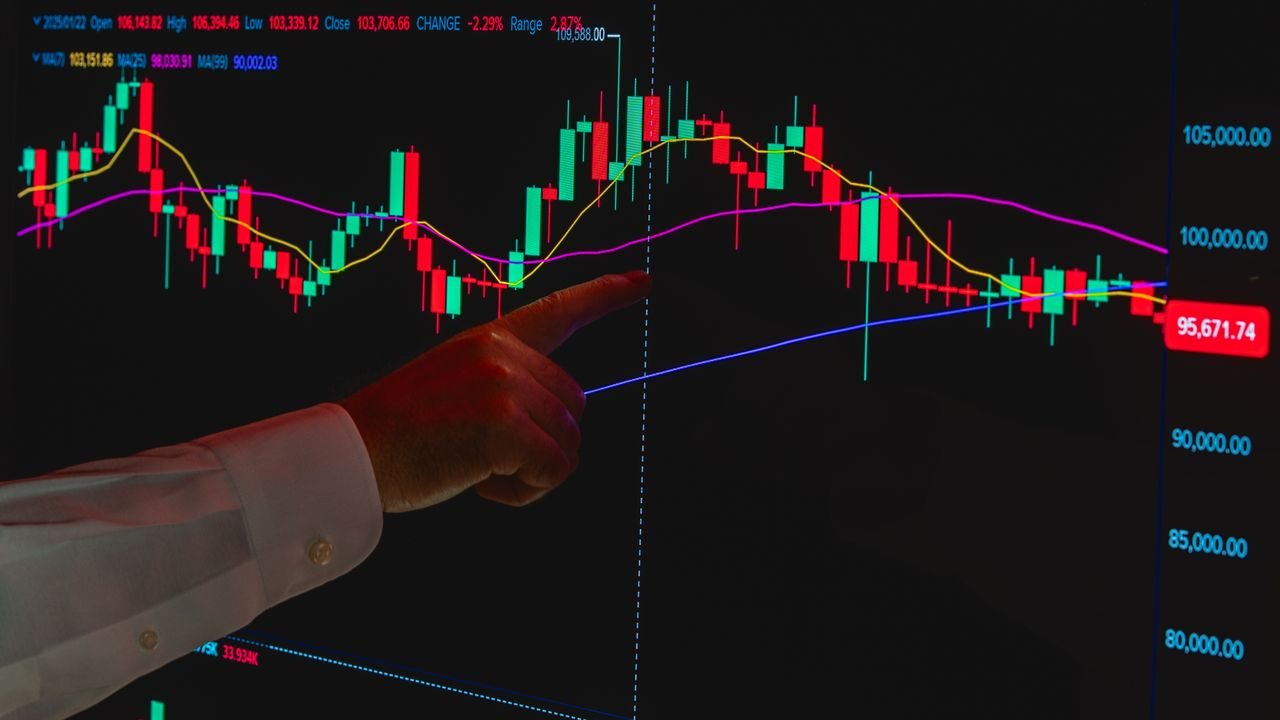

Tweezer tops and bottoms are two-candle reversal patterns in which neighbouring candles share almost the same high or the same low. A tweezer top forms after a rise and shows buyers failing twice at one price; a tweezer bottom forms after a fall and shows sellers failing twice at one price. On their own they mean little; at a level you marked in advance, they are worth a closer look.
Quick answer: what are tweezer tops and bottoms?
A tweezer top is two adjacent candles with matching highs after a rise, usually a bullish candle followed by a bearish one. A tweezer bottom is two adjacent candles with matching lows after a fall. Both show price rejected twice at the same level. Traders usually wait for a break of the pattern before acting.
What tweezer tops and bottoms look like
If candle bodies and wicks are new to you, start with how to read candlestick charts for beginners. A textbook tweezer has three features:
- Two neighbouring candles whose highs (for a top) or lows (for a bottom) sit at nearly the same price.
- A move into the pattern: a rise before a tweezer top, a fall before a tweezer bottom.
- A change of control: most often the first candle runs with the move and the second closes against it.
Opposite colours are common but not essential. We read the pattern as stronger when the second candle closes firmly against the earlier move.
How close do the highs or lows need to be?
Perfectly equal prices are rare, but a gap of half a candle’s range is not a tweezer at all. We scale the tolerance to the market rather than using a fixed number of pips.
Our working rule is that the two extremes should sit within about one tenth of a typical candle’s range on that timeframe. On a daily chart where candles usually span 100 points, highs within 10 points of each other count. The average true range indicator gives you that typical range without guesswork.
What the pattern says about buyers and sellers
Take a tweezer top. Buyers push to a high, try again on the next candle and stall at the same price. Two failures at one level show enough selling there to absorb the buying, at least for now.

There is a practical reason levels like this hold for a while. A Federal Reserve Bank of New York study of one large dealing bank found that stop-loss and take-profit orders cluster strongly at round numbers, and that take-profit orders tend to halt trends while stop-loss orders tend to speed them up. Matching highs at a round number may be take-profit orders being filled; a break through them can trigger the stops that sit just beyond, which is why we cover why psychological round-number levels matter separately.
Tweezers compared with other reversal patterns
A tweezer is the shortest version of a familiar idea. When two highs match weeks apart, you have the pattern in our guide to double top and double bottom patterns; when they match on consecutive candles, you have a tweezer. The tweezer simply gives you less evidence.
Tweezers also overlap with single-candle and two-candle rejections. If the second candle’s body swallows the first, the pair is also an engulfing pattern, explained in our engulfing candle strategy at support and resistance. If either candle has a long wick, it may be a pin bar as well.
| Pattern | Candles | Key feature | What it shows |
|---|---|---|---|
| Tweezer top or bottom | Two, adjacent | Matching highs or lows | Same level rejected twice |
| Double top or bottom | Many, two swings | Matching swing points | Level rejected over time |
| Engulfing candle | Two | Second body covers the first | Control switches sides |
| Pin bar | One | Long wick, small body | Push rejected in one session |
Where tweezer tops and bottoms matter
Matching highs in the middle of a range are just noise. We only take notice when the tweezer forms at a level we had marked before it appeared, ranked with our guide to which key levels count and how to rank them. Good places include:
- A supply or demand zone, drawn with our method for how to draw and trade supply and demand zones.
- A previous swing high or low that has turned price before.
- A round number that other traders are likely to watch.
- The 4-hour or daily chart, where each candle carries enough trading to mean something.
The evidence that levels themselves carry information is encouraging but limited. Older research from the New York Fed found strong evidence that published support and resistance levels helped predict intraday trend interruptions in currencies, although the effect varied by currency and by firm. We have found no reliable, sourced success rate for tweezers themselves, so we treat them as a clue at a level.
How to trade a tweezer: entry, stop and target
- Location: the tweezer forms at a level you marked in advance.
- Trigger: for a tweezer bottom, wait for a later candle to break above the second candle’s high; for a top, below its low.
- Stop: a buffer beyond the matching lows or highs. If price trades through both, the rejection has failed. Our guide to where to place a stop loss with price action explains buffers.
- Target: the next opposing level. If it sits closer than twice the stop distance, we skip the trade.
- Size: set the stake from the stop distance using how to calculate position size for forex, CFDs and spread bets.

Worked example: a tweezer bottom at a demand zone
All figures are hypothetical. On an £8,000 account we risk 1% per trade, which is £80. A currency pair has fallen into a daily demand zone around 1.2500.
- Candle one: bearish, opening at 1.2560, low of 1.2502, closing at 1.2510.
- Candle two: bullish, low of 1.2503, closing at 1.2555 with a high of 1.2562. The lows are one pip apart.
- Trigger: the next candle breaks above 1.2562, so we buy at 1.2565.
- Stop: 1.2490, below both lows with a buffer, which is 75 pips away. £80 divided by 75 pips is about £1.07 per pip, so we round down to £1 per pip and risk £75.
- Target: resistance at 1.2715, 150 pips away, so the potential gain is about £150, twice the risk.
If price falls back through 1.2490, we lose about £75 plus the spread. Spread bets and CFDs are leveraged, so a gap through the stop could make the loss larger than planned.
Common mistakes with tweezer patterns
- Trading every pair of equal highs. On low timeframes they appear constantly and mean little.
- Ignoring the trend. In a strong move, a tweezer is often just a pause before continuation.
- Stops exactly at the matching price. Equal highs and lows attract stop orders, and price often runs them by a few points.
- No room to the target. A neat tweezer with the next level close by is still a poor trade.
Frequently asked questions
Is a tweezer bottom bullish?
Yes. It forms after a fall and shows sellers failing twice at the same low, which can warn of a turn higher. We still wait for a break above the pattern before acting.
Do tweezer candles have to be opposite colours?
No, though it is the most common form. A second candle closing against the move makes the rejection clearer.
What is the difference between a tweezer top and a double top?
Both show matching highs. A tweezer uses two adjacent candles, while a double top forms over two separate swings and usually carries more weight.
Which timeframe works best for tweezers?
We prefer the 4-hour and daily charts. On very short timeframes, matching highs and lows appear so often that they carry little information.
Next steps
Tweezers work best inside a wider reading of the chart, which our complete beginner’s guide to price action trading builds step by step. For another two-candle turn, see our guide to the dark cloud cover and piercing line patterns.
Supply and demand, and a filters and trigger process for entries, are both part of our price action trading course, and the basics section is free to start.
This article is for education only and is not financial advice. Trading leveraged products such as CFDs and spread bets carries a high risk of losing money.