
Learning how to use volume to confirm a trend comes down to one question: is participation growing in the direction price is moving, or fading? We read volume as a second opinion on price, never as the reason to trade. Used that way, it helps separate breakouts and trend legs with real interest behind them from moves that are running on empty.
Quick answer: how do you use volume to confirm a trend?
Compare volume with its recent average. In a healthy uptrend, volume is heavier on up legs and breakouts and lighter on pullbacks; the reverse applies in a downtrend. Rising price on shrinking volume (divergence) or one huge bar after a long run (a climax) warns the move may be tiring. Price still makes the decision.
What volume confirmation means in practice
Volume tells you how much activity sat behind a price move. If you want the theory first, our guide to how volume behaves at key decision levels explains why a move needs more fuel to push through support or resistance. This article is the practical side: what to look for on the chart before and after you take a trade.
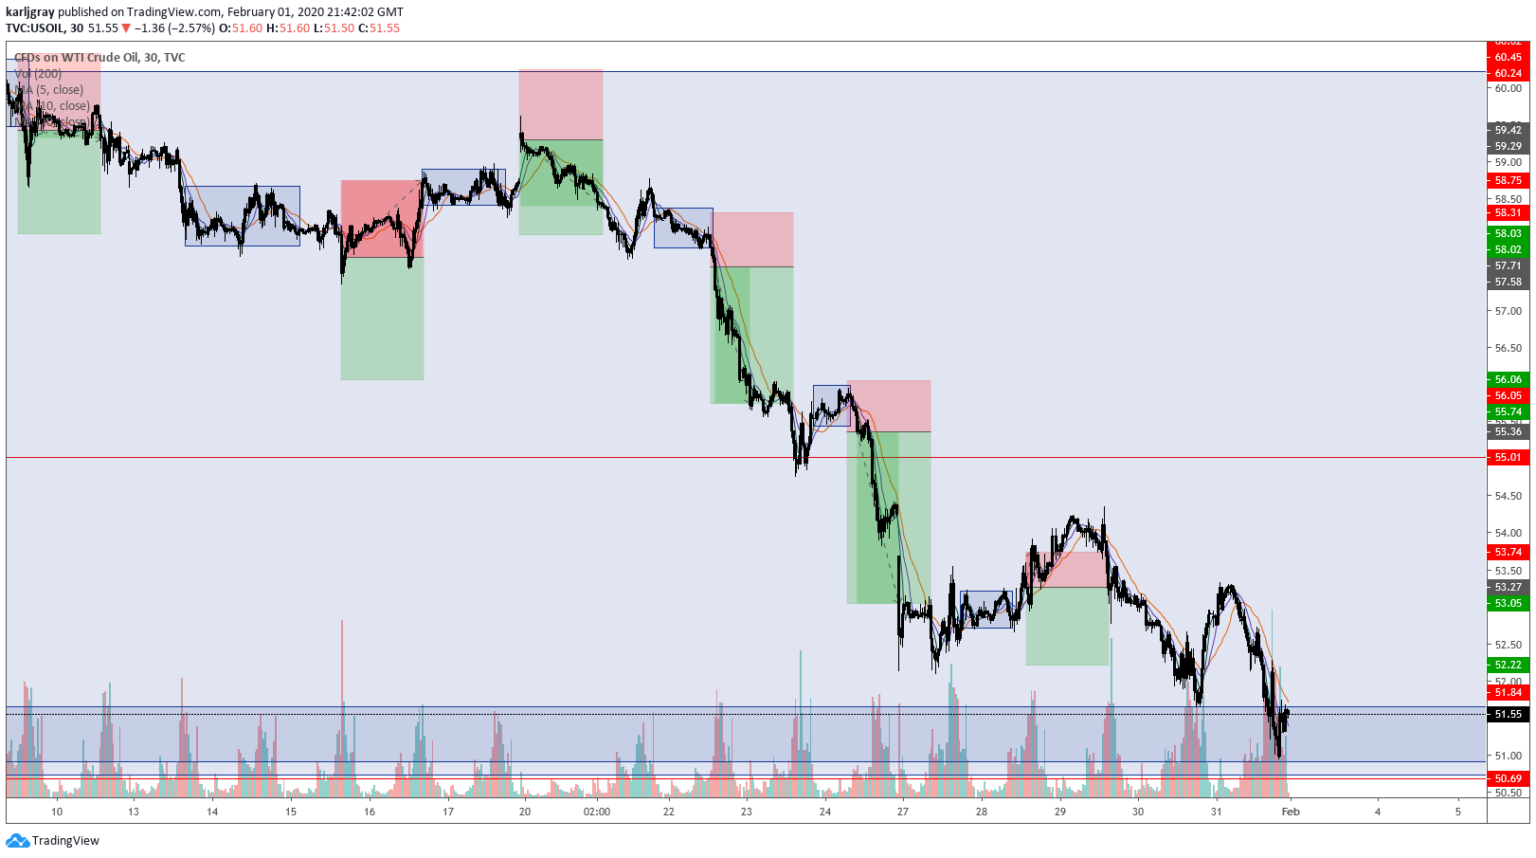
Karl recorded this original video showing the idea on a 30-minute chart, using volume alongside the daily trend direction:
Notice the order he works in. The daily chart sets the direction, price shows the setup, and volume only confirms or questions what price is already saying. That is the core of volume price action trading.
Forex volume is tick volume, not a central figure
Shares and futures trade on exchanges that record every contract, so their volume is a single, complete number. Spot forex is different. As the US regulator’s investor education site explains, most retail forex trades happen off-exchange, with no exchange or central clearinghouse, so nobody publishes a true total.
The volume bars on most forex platforms are tick volume: a count of how many times the price changed in each candle, taken from your broker’s own feed. A one-lot order and a hundred-lot order can each register as a single tick. Two brokers can therefore show different numbers for the same candle.

Why tick volume is still useful
In our experience, tick volume rises and falls with real activity closely enough to be worth reading, provided you compare it with itself. A bar that is twice the recent average means something; the raw number does not. Indices, gold and other markets traded as futures do have exchange volume, which some traders check alongside their CFD chart. Tick volume also drives the forex version of the day’s average price, as our VWAP trading strategy guide explains.
How to use volume to confirm a trend: four situations
These are the four situations where volume earns its place on our charts. In each one, we read it at or near a level, not in the middle of nowhere.
1. Breakouts from a level
A breakout through a zone with volume well above average suggests real participation. A breakout on thin volume is more likely to drift back inside the range. Our article on avoiding false breakouts covers the price side of this.
2. Trend legs and pullbacks
In a healthy uptrend, the legs up carry heavier volume and the pullbacks lighter volume. That pattern says buyers are active on the push and sellers are not committing on the dip. When pullbacks start to carry more volume than the legs, the trend is being questioned.
3. Climaxes
A climax is an unusually large volume bar after a long, extended run, often with a wide candle. It can mark the last rush of late buyers or panicked sellers rather than the start of something new. We treat a climax into a level as a reason to stop adding, not a reason to reverse.

4. Divergence
Divergence is price making a new high while volume on that push is lower than on the last one. Fewer participants are driving the move. It is a warning, not a trigger, and price can keep grinding on in that state for longer than expected.
Price and volume combinations at a glance
This table summarises how we read the main combinations. It assumes you are comparing volume with its own recent average on the same timeframe.
| Price | Volume | What it suggests |
|---|---|---|
| Rising in a trend leg | Rising | Participation supports the move |
| Rising to new highs | Falling | Divergence: buyers thinning out |
| Pulling back | Light | Normal pause in a healthy trend |
| Pulling back | Heavy | Trend under real pressure |
| Breaking a level | Well above average | Breakout more likely to hold |
| Breaking a level | Below average | Higher risk of a false break |
| Extended run, huge bar | Extreme spike | Possible climax or exhaustion |
A worked example of volume confirmation
Example, using hypothetical figures: on a £5,000 account, a trader has marked a resistance zone on a 1-hour chart in a market whose daily trend is up. Over the last 20 candles, tick volume has averaged about 1,000 per hour.
- Price breaks above the zone with a strong close. That candle prints 2,300 ticks, more than double the average.
- The trader checks the clock. It is not the London open, when activity always jumps, so the spike is not just the session starting.
- Price pulls back to the top of the old zone on candles of 600 to 700 ticks: a light, orderly retest.
- A bullish candle closes off the retest, and the trader enters with a stop below the zone, risking 1%, or £50.
If the breakout had come on 800 ticks, the trader would have treated it as unconfirmed and waited. Volume did not pick the trade; it raised confidence in a setup the chart had already offered. Sizing it at 1% follows the approach in our guide on how much to risk on each trade. Leveraged products such as CFDs and spread bets magnify losses as well as gains, so the stop matters more than the volume reading.

Common mistakes with volume
- Treating every spike as “smart money”. Session opens, news releases and rollovers all lift volume without telling you direction.
- Comparing raw numbers across brokers or markets. Tick volume only makes sense relative to the same feed and timeframe.
- Using volume as the trigger. It belongs in your filters, as set out in our filters and triggers entry checklist, while price provides the trigger.
- Reading volume away from a level. A big bar in the middle of a range rarely means much.
- Fading every divergence. Divergence can last for weeks while price keeps rising.

Volume also helps with the bigger question of trend direction. When a new trend starts, the first leg that breaks structure often carries noticeably more activity, which is worth checking alongside our steps for spotting the start of a new trend with price action.
Frequently asked questions
Does volume work in forex?
Yes, as a relative measure. Retail forex platforms show tick volume from your broker, not a market-wide total, so compare each bar with the recent average rather than reading the raw number.
Should volume increase on a breakout?
Ideally, yes. A breakout with volume well above average suggests real participation, while a thin breakout has a higher chance of failing and slipping back into the range.
What does falling volume in an uptrend mean?
On pullbacks, light volume is normal and healthy. On new highs, falling volume is divergence: fewer participants are pushing price, so we tighten management and stop adding rather than reversing. Volume is one of several confirming tools; the best technical indicators for beginners covers others that pair well with price action.
What timeframe is best for volume?
Use volume on the timeframe you trade, and confirm direction on a higher one, as Karl does with the daily trend and the 30-minute chart. Very low timeframes are noisy and dominated by session effects.
Next steps
Volume is one input in a wider read of the chart. Our step-by-step guide on how to read price action on any chart shows where it fits, and the beginner’s guide to price action trading covers the foundations. Knowing when not to trade at all matters just as much as reading a confirmation.
If you want a structured route, the free basics section of our price action trading course builds this from the ground up.
This article is for education only and is not financial advice. Trading leveraged products such as CFDs and spread bets carries a high risk of losing money.