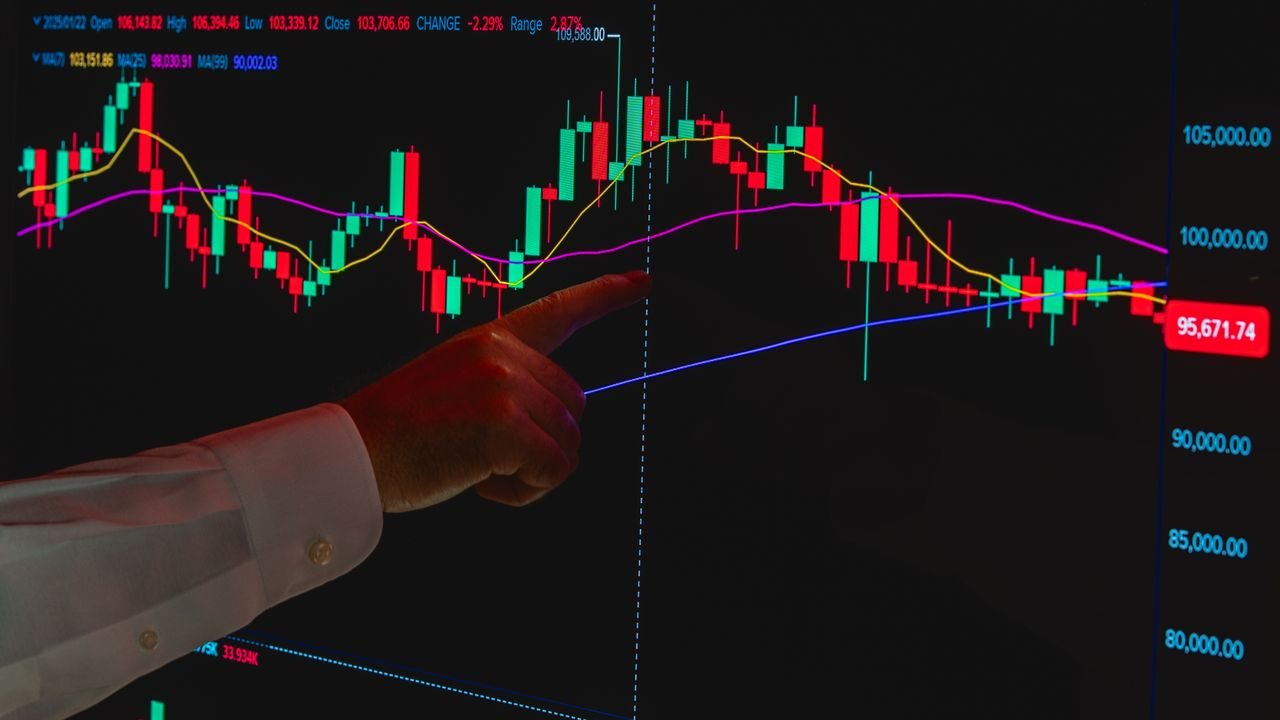

Bitcoin market cycles are the repeated stretches of strong rises, sharp peaks and deep falls that Bitcoin has shown since it launched. Many traders link them to the “halving”, a built-in cut to new supply roughly every four years. With bitcoin market cycles explained honestly, the halving is a known fact and the cycle is a loose historical pattern, not a timetable.
Quick answer: what are Bitcoin market cycles?
Bitcoin market cycles are the recurring phases of accumulation, rally, peak and long decline seen in Bitcoin’s history. They are often tied to the halving, which cuts the reward for mining new blocks about every four years. Only four halvings have happened, so past cycles are a small sample and cannot predict the next one.
What the Bitcoin halving is
New bitcoins are created as a reward to miners, the computers that process transactions and add blocks to the chain. Bitcoin’s rules cut that block reward in half every 210,000 blocks, which works out at roughly every four years. The total supply is capped at 21 million coins.
That fixed schedule is deliberate. The Bank for International Settlements, in its 2018 annual report chapter on cryptocurrencies, notes that Bitcoin’s supply is predetermined by its protocol and cannot respond to demand. It argues this is one reason cryptocurrency valuations are extremely volatile.
| Halving | Date | Block reward (BTC) |
|---|---|---|
| First | 28 November 2012 | 50 to 25 |
| Second | 9 July 2016 | 25 to 12.5 |
| Third | 11 May 2020 | 12.5 to 6.25 |
| Fourth | 20 April 2024 | 6.25 to 3.125 |

How past Bitcoin cycles are usually described
Commentators tend to split each cycle into four phases. The names vary, but the shape is similar.
- Accumulation: after a long fall, price moves sideways and interest is low.
- Rally: price breaks out of the range and trends higher, often in the year or so after a halving.
- Peak: momentum accelerates, attention and speculation surge, then the trend breaks.
- Decline: a long bear market with very large drawdowns from the high.
The usual story is that a smaller flow of new coins meets steady or rising demand, pushing price up. That story is plausible, but it is only one influence among many, including global interest rates, liquidity and the arrival of large new buyers.
The same boom and bust, seen from the desk
We wrote about the excitement of earlier rallies at the time, including our piece asking whether Bitcoin was a bubble. The lesson that has held up is about behaviour rather than dates: crowds get very confident near peaks and very gloomy near lows.

Why past Bitcoin market cycles may not repeat
Four halvings give a tiny sample. You would not trust any other trading pattern that had only appeared a handful of times, and the same caution applies here.
- Each halving matters less: the reward cut is a smaller share of total supply every time.
- Participants have changed: funds and exchange-traded products now trade alongside individuals.
- Macro conditions differ: interest rates and liquidity were different in each cycle.
- Everyone knows the pattern: when traders try to front-run a widely watched cycle, timing shifts.
Market commentary since 2024 has been split between people saying the four-year cycle is over and people saying it has simply stretched. We don’t need to pick a side. Our approach is to read what price is doing now rather than what the calendar says it should do.

Reading the Bitcoin long-term trend with price action
The weekly chart filters out much of the day-to-day noise. On it, we look at structure, not predictions. Our guide to price action trading crypto applies the same approach to entries.
- Mark the major swing highs and lows on the weekly chart.
- Label the trend: higher highs and higher lows is up, lower highs and lower lows is down, overlapping swings is a range.
- Note the key zones where price turned sharply, using the ideas in our guide to drawing supply and demand zones.
- Wait for structure to change before calling a new trend, as explained in how to identify a new trend early.
- Drop to the daily chart only to plan entries in the direction of the weekly structure.
Because Bitcoin has moved so far over its life, many traders view its long-term chart on a logarithmic scale, where equal percentage moves take up equal space. That makes early and recent swings comparable. Our walkthrough on breaking down charts from higher to lower timeframes shows the full top-down routine.
When the weekly structure and the cycle story disagree, we follow the structure. If the calendar says a rally “should” be under way but the chart is still making lower highs and lower lows, the chart is the evidence and the calendar is only an opinion. That one habit removes a great deal of wishful thinking.

Risk: what the cycles mean for your money
Bitcoin has historically fallen a very long way after each peak, and any cryptoasset can fall to zero. Cryptoassets are largely unregulated in the UK for consumer protection, compensation schemes are unlikely to help if something goes wrong, and you could lose all your money.
Leverage, including crypto CFDs, magnifies losses as well as gains, and a volatile market can move through your stop. Work out size in advance with our guide to calculating position size for a set risk, always use a stop loss on every trade, and follow our guide to keeping your cryptocurrency safe from theft for any coins you own.
Worked example: sizing for a volatile market
Example: on a hypothetical £5,000 account risking 1% per trade, the most you lose on one idea is £50. If a sensible stop on the weekly structure sits 20% below entry, the position can only be £250. That small number is the point: wide stops in a volatile market demand small positions.

Common mistakes
- Treating the halving date as a buy signal.
- Drawing past cycles forward as forecasts.
- Ignoring how deep previous declines were.
- Using leverage on a market that can move sharply in a single day.
- Letting fear of missing out override the plan, a trap covered in our article on controlling emotional trading decisions.
Frequently asked questions
When were the Bitcoin halvings?
The four halvings so far took place on 28 November 2012, 9 July 2016, 11 May 2020 and 20 April 2024. Each one cut the block reward for miners in half.
Does the halving cause Bitcoin bull markets?
Past rallies have followed halvings, but there have only been four, which is far too few to prove cause and effect. Interest rates, liquidity and new types of buyer have also driven Bitcoin’s price.
Is the four-year cycle dead?
Nobody knows. Some analysts argue exchange-traded products and institutional buying have changed the pattern, while others say it has just stretched, so we read the current price structure instead.
How do you read Bitcoin’s long-term trend?
Use the weekly chart, ideally on a logarithmic scale, and mark swing highs and lows. With bitcoin market cycles explained this way, the trend is whatever the structure shows now.
Next steps
See how Bitcoin’s share of the crypto market fits in with our guide to reading the Bitcoin dominance chart, and ground your method in our beginner’s guide to price action trading. The free basics section of our price action trading course covers how to look at markets differently, including crypto.
This article is for education only and is not financial advice. Trading leveraged products such as CFDs and spread bets carries a high risk of losing money.