
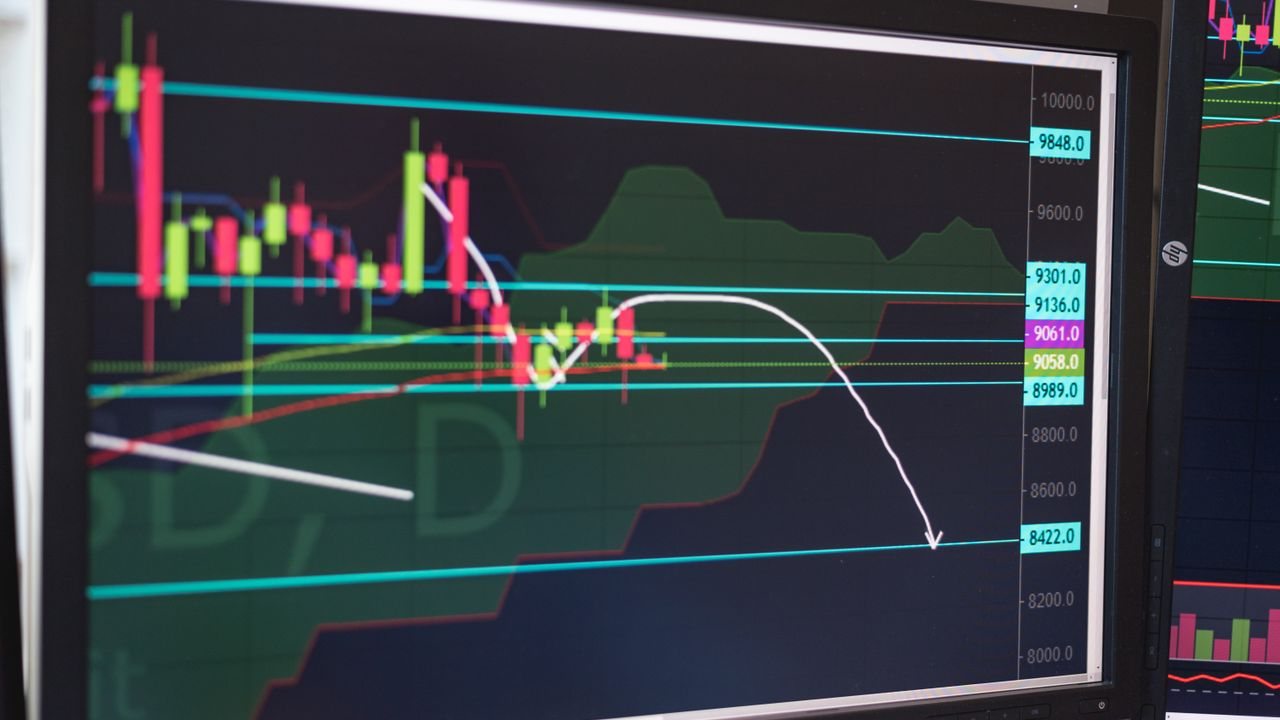
A stochastic oscillator strategy uses the stochastic indicator to judge whether momentum is turning, then acts only when that turn happens at a price level you marked in advance. In our experience the indicator is weakest when it is read on its own and most useful as a timing check at a support, resistance or supply and demand zone.
Quick answer: what is a stochastic oscillator strategy?
The stochastic oscillator shows where the latest close sits within the recent high-low range, on a scale of 0 to 100. A stochastic oscillator strategy uses readings above 80 or below 20, and crossovers of its two lines, to time entries in the direction of the trend at a pre-marked price level, with a stop beyond structure.
Stochastic indicator explained: what it measures
If indicators are new to you, start with our best technical indicators for beginners, then come back here. The stochastic, developed by George Lane, asks one simple question: is price closing near the top or the bottom of its recent range?
The %K line
The main line takes the latest close, subtracts the lowest low of the last 14 periods, and divides by the full high-low range of those periods. Multiplied by 100, that gives a reading from 0 to 100. A reading of 90 means the close is near the top of the range; a reading of 10 means it is near the bottom.
The %D line
The second line is a three-period moving average of the first. Because it smooths the main line, it turns later, and the points where the two lines cross are what most traders call a stochastic crossover.
Fast, slow and full versions
The fast version uses the raw, jagged main line. The slow version smooths it first, and the full version lets you set the lookback and both smoothing periods, hence the common 14, 3, 3 setting.
Overbought and oversold: what 80 and 20 really mean
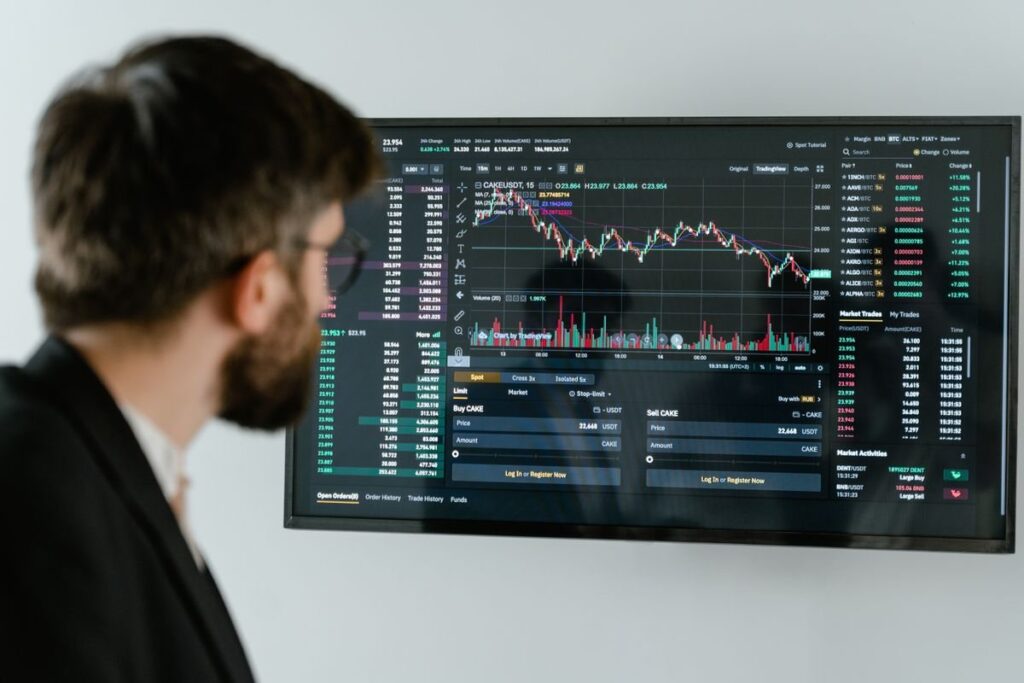
A reading above 80 is usually called overbought and below 20 oversold. All it actually says is that the close is near the top or bottom of the last 14 bars. In a strong uptrend, price keeps closing near its highs, so the stochastic can sit above 80 for a long time while price keeps rising.
That is why “overbought, so sell” is the most expensive habit with this indicator. We read 80 and 20 as descriptions of where momentum is, not as instructions. A dip below 20 inside an uptrend is far more interesting to us than a reading above 80 against it.
| Reading | In an uptrend | In a range |
|---|---|---|
| Above 80 | Strength; not a reason to sell | Price near the top of the range |
| Below 20 | Pullback; watch for a turn up | Price near the bottom of the range |
| Crossover near 50 | Mostly noise | Mostly noise |
| Divergence | Early warning only | Can hint at a failed breakout |

What the evidence says about oscillators
A CFA Institute Research Foundation review, Technical Analysis: Modern Perspectives, notes that oscillators such as RSI and stochastics are especially popular with short-term traders. It links this to research suggesting short-term traders are more likely to do well with mean-reversion approaches, while trend tools suit longer horizons.
The same review also reports conflicting results across studies, including an out-of-sample test that found no evidence for several well-known technical rules. So we do not claim any stochastic rule has an edge. We use it as a timing aid inside a method, and we test our own rules with the steps in our guide on how to backtest a strategy.

A stochastic oscillator strategy, step by step
The level and the trend come first; the indicator only times the entry.
- Define the trend on a higher timeframe; our trend following strategy with rules for riding trends sets out how.
- Mark the level before price gets there: a previous swing, a key level or one of our supply and demand zones.
- Wait for the pullback into that level, with the stochastic dropping below 20 in an uptrend or rising above 80 in a downtrend.
- Take the turn. The faster line crosses back over the slower one and out of the extreme zone, ideally with a rejection candle.
- Place the stop beyond the level or the pullback’s swing point, never at an indicator value.
- Size the trade from that stop distance and set the exit before entry.
In a sideways market the same tool works the other way round: readings near 80 and 20 line up with the edges of the range. Our range trading strategy for sideways markets and our guide to mean reversion trading cover that approach.

Stochastic vs RSI and MACD
All three are momentum tools built from the same prices, so they often agree. The stochastic measures the close against the recent range, RSI compares the size of up and down moves, and MACD measures the gap between two moving averages.
- Stochastic reacts fastest, which suits short-term timing at levels but produces more noise.
- RSI is smoother; our guide to RSI divergence trading with confirmation covers divergence in depth, and the method is the same on the stochastic.
- MACD is slower and better as a trend filter, as our MACD trading strategy guide explains.
Pick one. Three momentum tools agreeing is one opinion repeated three times, not three confirmations.
Worked example: a hypothetical stochastic pullback trade
All figures are hypothetical. On a £5,000 account we risk 1% per trade, which is £50. An index has made higher highs and higher lows on the daily chart, and we have marked a demand zone from 7,480 to 7,500 on the 1-hour chart.
- Pullback: price falls into the zone and the stochastic drops to 12.
- Turn: the faster line crosses above the slower one and back over 20 as a bullish candle closes at 7,512.
- Stop: 7,470, below the zone, so 42 points of risk. At about £1.19 per point, that is £50.
- Exit plan: the target is the recent high at 7,600, 88 points away, set before entry.
If price breaks below 7,470 instead, we take the £50 loss and wait. CFDs and spread bets are leveraged, so gaps and fast markets can move price through a stop and cost more than planned; our guide to how much to risk per trade explains the sizing.

Common mistakes with the stochastic
- Selling every reading above 80. In a strong trend the stochastic can stay overbought for weeks.
- Trading every crossover. The lines cross constantly in the middle of the scale, and most of those crosses mean nothing.
- Using it without a level. A turn from oversold in the middle of nowhere gives you no logical place for a stop.
- Tweaking settings after losses. Faster settings add noise; consistency matters more than the numbers.
- Letting the indicator overrule price. Our guide to price action vs indicators explains why the chart comes first.
Frequently asked questions
What are the best stochastic settings?
Most traders use 14, 3, 3 on the slow or full version, and we do too. Faster settings such as 5, 3, 3 react sooner but add noise.
Does overbought mean price will fall?
No. Overbought only means the close is near the top of its recent range. In a trend that can continue for a long time, so we treat it as context rather than a reason to sell.
Is the stochastic better than RSI?
Neither is better; they measure momentum in slightly different ways. The stochastic is faster and noisier, RSI is smoother, and using both rarely adds much.
Does the stochastic work for day trading?
It can be used on intraday charts, but lower timeframes produce more crossovers and more false turns. A higher-timeframe trend and a pre-marked level matter even more there.
Next steps
The stochastic only helps once you can find the level it should be read at, so start with our guide to trading key levels before adding any indicator.
Price action with technical analysis, and the filters and trigger process we use, are both part of our price action trading course, and the basics section is free to start.
This article is for education only and is not financial advice. Trading leveraged products such as CFDs and spread bets carries a high risk of losing money.


