

Fair value gap trading means marking the price range a fast, one-sided move skipped over, then watching how price behaves when it returns to that range. The idea comes from ICT and “smart money” teaching, and in our experience it is most useful as a way of seeing imbalance near a supply or demand zone, not as a stand-alone entry rule.
Quick answer: what is a fair value gap?
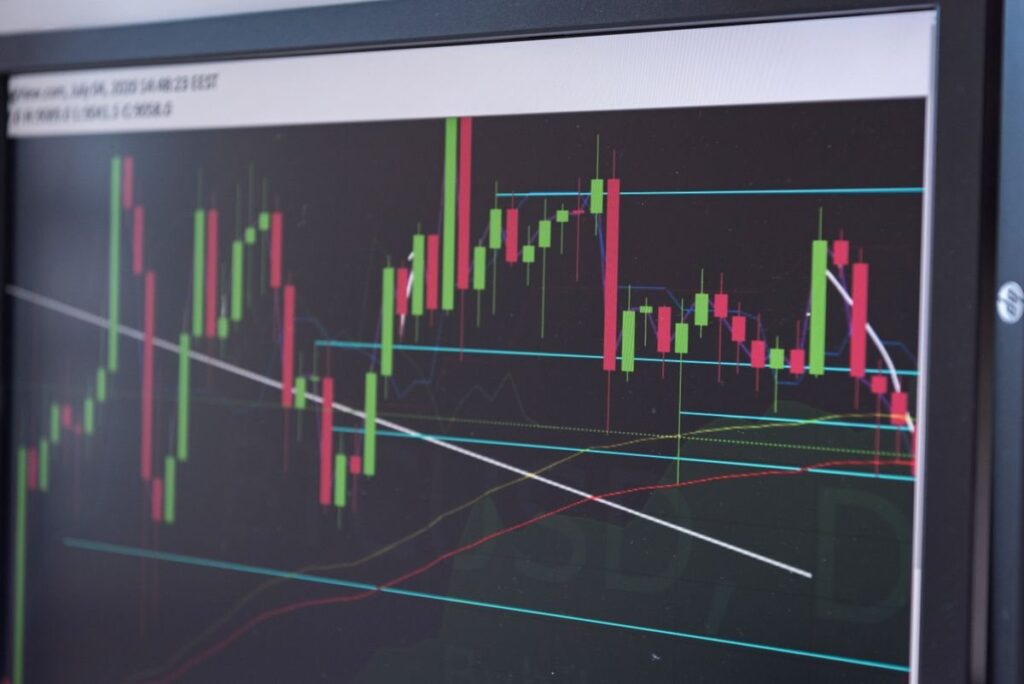
A fair value gap (FVG) is a three-candle pattern where a large middle candle moves so fast that the first candle’s high and the third candle’s low do not overlap (or the reverse in a fall). The space between them shows where trading was one-sided. Traders watch it as a possible reaction area when price returns.
Fair value gap explained: the three-candle pattern
Every FVG is built from three consecutive candles. The middle one is the impulse, a large candle that travels a long way in one direction, and the gap is the range its neighbours leave untouched.
Bullish fair value gap
In a rise, compare the high of the first candle with the low of the third. If the third candle’s low sits above the first candle’s high, the space between them is a bullish FVG. Traders watch for price to dip back into it and find buyers.
Bearish fair value gap
In a fall, the logic flips. If the third candle’s high sits below the first candle’s low, the range between them is a bearish FVG.
Many traders also mark the gap’s midpoint, which ICT followers call “consequent encroachment”. It is simply the halfway price.
Imbalance in trading: why fast moves leave gaps
An FVG is really a picture of imbalance in trading: for a short time, one side of the market overwhelmed the other, so price moved through a range without much two-way business. That is the same idea behind the departure from a zone in our guide to supply and demand zones.
What drives those fast moves? Research from the Federal Reserve Bank of New York on stop-loss orders and price cascades in currency markets found that trends were unusually rapid when rates reached levels where stop-loss orders tended to cluster, and that stops could trigger in waves. The effect showed up over hours rather than days, which fits the intraday scale on which most FVGs are drawn.
That links FVGs to liquidity and where orders sit, and to why price seems to hunt stops before reversing. Context matters more than the gap itself.
What the evidence does and does not show
We need to be honest here. We know of no published study that tests fair value gaps as defined by ICT, so any claim about how often they “fill” or hold comes from traders’ own charts. The pattern is new jargon for older ideas: imbalance, gaps and levels.
There is some research on those older ideas. A New York Fed paper on support and resistance in intraday exchange rates found that levels published by foreign exchange firms helped predict where intraday trends paused, although the effect varied across currencies and firms. That supports marking levels, not three-candle gaps in particular.
So we treat an FVG as a hypothesis to test. Our guide on how to backtest a trading strategy shows how to check your rules first.
FVGs vs order blocks, zones and price gaps
Beginners often collect FVGs, order blocks and zones as separate tools. In practice they usually describe one event: a base where orders were filled, then an impulsive move away.
| Concept | What it marks | How we use it |
|---|---|---|
| Fair value gap | Range the impulse skipped | Evidence of a strong departure |
| Order block | Last opposite candle before the impulse | Refines where the base sits |
| Supply or demand zone | The base the move left from | Main level for entries and stops |
| Price gap | Open far from the last close | Session or weekend risk, not an FVG |
Our order block trading guide covers the candle before the impulse, and our gap trading strategy covers true session and weekend gaps. An FVG has no missing prices; it is a range traded only briefly.
How we approach fair value gap trading step by step
If we use FVGs at all, it is as a filter inside the zone process, never on their own.
- Read the higher timeframe. Decide the trend first; our guide to market structure trading explains highs and lows.
- Mark the zone, then the gap. Find the base the impulse left from, and note whether it left an FVG.
- Check freshness. A zone price has not returned to is more interesting than one already tested; see fresh vs tested zones.
- Wait for the return. Let price come back rather than chasing the impulse.
- Look for a reaction. A rejection candle at the gap or zone comes before any entry.
- Place the stop beyond the zone, not inside the gap, and size the position from that distance.
A gap in the direction of the higher-timeframe trend deserves more attention than one against it.

Worked example: a hypothetical bullish FVG
All figures are hypothetical. On a £5,000 account we risk 1% per trade, which is £50. A currency pair is in an uptrend on the 4-hour chart, and on the 15-minute chart price builds a small base between 1.0820 and 1.0835.
- The impulse: a large candle lifts price out of the base. The first candle’s high is 1.0850 and the third candle’s low is 1.0872, so the FVG runs from 1.0850 to 1.0872.
- The return: price drifts back through the midpoint at 1.0861 and prints a bullish rejection candle.
- Entry and stop: we buy at 1.0860 with a stop at 1.0815, below the base, so 45 pips of risk. At about £1.11 per pip, that is £50.
- Exit plan: the target is the recent high at 1.0950, 90 pips away.
If price falls through the base instead, the gap and the zone have failed and we take the £50 loss. CFDs and spread bets are leveraged, so a fast market can move through a stop and cost more than planned. Our guide to how much to risk per trade covers the sizing in more detail.

Common mistakes with fair value gaps
- Marking every gap. Lower timeframes are full of them, so most mean nothing without a zone and a trend behind them.
- Assuming every gap fills. Many are never revisited, and some are revisited only after price has gone much further.
- Stops inside the gap. Price often trades through the whole gap before reacting, so a stop at its edge is easily hit.
- Treating new labels as an edge. Inverse gaps, breakers and midpoints add vocabulary; only testing shows whether they add anything.
Frequently asked questions
Do fair value gaps always get filled?
No. Some are revisited quickly, some much later and some never, and we know of no reliable study putting a number on it. Treat the idea that gaps must fill as a belief, not a rule.
Is a fair value gap the same as an imbalance?
It is one way of drawing an imbalance. The gap shows where buying or selling was so one-sided that little two-way trade took place, just as a strong departure from a zone does.
What is an inverse fair value gap?
It is a gap that price has closed straight through, after which some traders expect it to act in the opposite role. It is old support becoming resistance under a new name.
Which timeframe is best for FVGs?
There is no best one, but higher timeframes produce fewer and more meaningful gaps. We set the bias on the 4-hour or daily chart and look for detail on the 15-minute chart at the lowest.
Next steps
FVGs only make sense once you can read the move around them, so start with our price action trading guide and keep the supply and demand hub close by.
Supply and demand, assessing whether a trade is worth the risk, and the filters and trigger process we use are all part of our price action trading course, and the basics section is free to start.
This article is for education only and is not financial advice. Trading leveraged products such as CFDs and spread bets carries a high risk of losing money.


