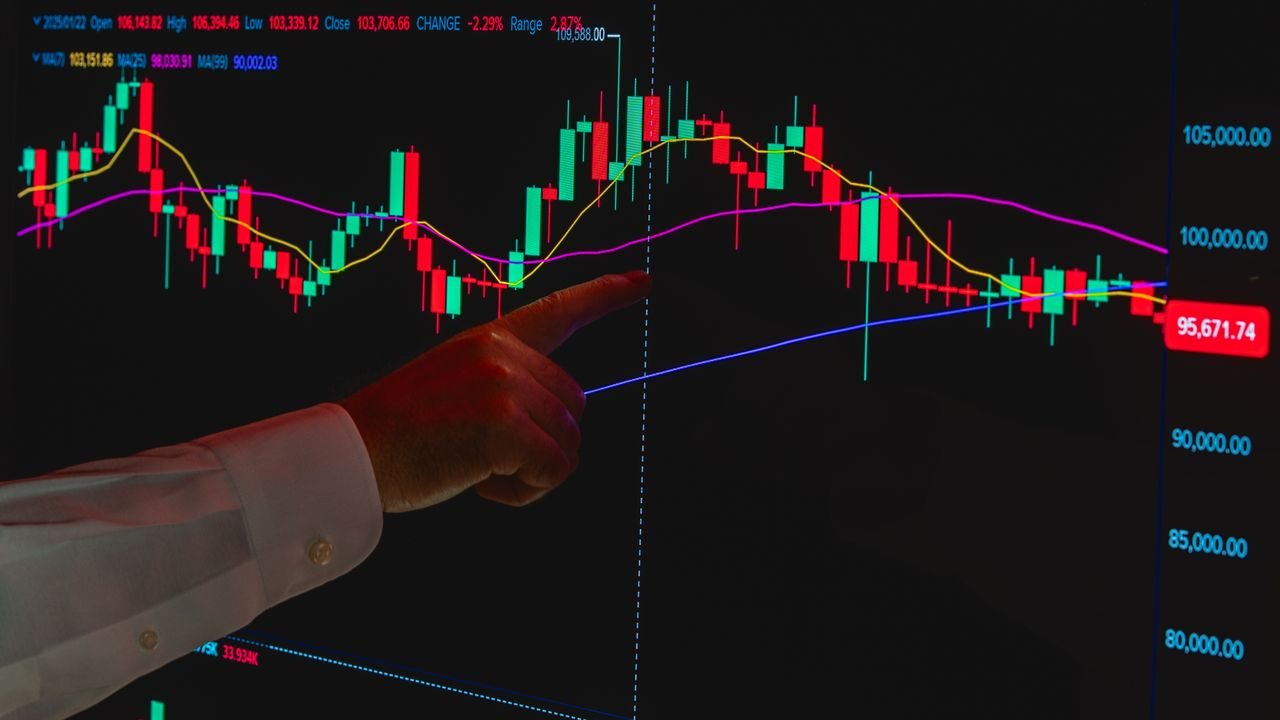
Fibonacci retracement trading means drawing a grid of levels between a swing low and a swing high, then watching those levels for a pullback to end and the trend to resume. Used well, it marks a zone to watch; used badly, it shows turning points that were never there.
Quick answer: what is Fibonacci retracement trading?
It is a way of measuring a pullback within a trend. You anchor the tool on the last clear swing, and it plots lines at 23.6%, 38.2%, 50%, 61.8% and 78.6% of that move. Traders then look for a price action signal at one of those levels, ideally where it lines up with an existing support or resistance level.
What Fibonacci retracement levels are
The levels come from ratios in the Fibonacci number sequence, where each number is the sum of the two before it. Ratios between those numbers, roughly 0.618 and 0.382, become horizontal lines across a price move.
- 23.6%: a shallow pullback, common in strong trends.
- 38.2%: a moderate pullback, often watched in healthy trends.
- 50%: not a Fibonacci ratio at all, but the halfway point, which traders watch anyway.
- 61.8%: the “golden ratio” level and the one most traders treat as the last line for the trend.
- 78.6%: a deep pullback; beyond it, the trend is in real doubt.
Our guide to the best technical indicators for beginners introduces the tool briefly. Here we go further: which swing to use, how to trade a level and what the evidence says.
How to draw Fibonacci retracement correctly
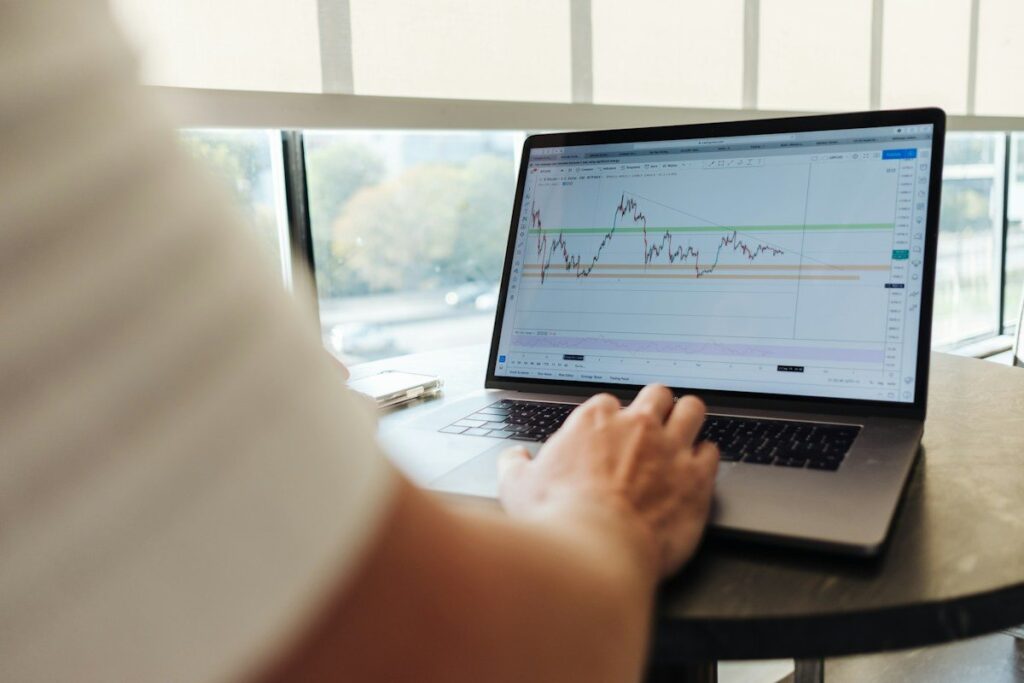
The tool is only as good as the swing you anchor it to. Two traders using different swings get different levels on the same chart, so we use a fixed rule.
- Confirm there is a trend. Look for higher highs and higher lows, or the reverse. Our guide to identifying market structure with highs and lows sets out how we define them.
- Pick the last completed swing. In an uptrend, that is the most recent swing low that led to a new high.
- Anchor in the direction of the move. In an uptrend, click the swing low and drag to the swing high; in a downtrend, click the high and drag to the low.
- Choose wicks or closes, then never switch. Both are used. Consistency matters more than the choice.
- Do not redraw to fit. Moving the anchors until a line matches a turn is how traders fool themselves.
Which timeframe to use
Draw on the timeframe where you identify the trend, then drop down to time the entry. Our article on a top-down multiple timeframe approach explains how the two timeframes fit together.

Does Fibonacci retracement trading work?
There is no solid evidence that the Fibonacci ratios have any special power in markets. The idea that nature’s golden ratio shows up in price is a belief, not a tested result.
The research we could find is thin. One peer-reviewed study tested Fibonacci retracements as a trading system on ten US energy stocks and four energy cryptocurrencies from late 2017 to early 2020. The levels tracked the stocks better than the cryptos, price broke through them often, and risk-adjusted returns were low. A short sample in one sector neither proves nor disproves the tool.
There is also a wider point. Work recognised by the 2013 Nobel Prize in economic sciences found that past prices are of very little use in predicting returns over the next few days or weeks. No drawing tool gets around that.
The hindsight problem
Five levels spread between 23.6% and 78.6% cover a wide band of any move, and plenty of ordinary pullbacks end somewhere in that band. So after almost any turn, you can find a level nearby and say “it bounced off the Fib”. That makes the tool look far more reliable on old charts than it is in live trading.

Why we still look at it
Many traders watch these levels, so orders can gather around them, especially 50% and 61.8%. We treat a Fibonacci level as a way to describe how deep a pullback is, and as one input among several. It is never the reason for a trade on its own.
Trading a retracement with price action
A level is a place to pay attention, not a place to buy. We want trend, location and a trigger to line up.
| Check | Fibonacci level alone | Level with confluence |
|---|---|---|
| Trend | Assumed | Confirmed by structure |
| Location | Any of five lines | Matches old support or resistance |
| Entry trigger | Price touches the line | Pin bar or engulfing close |
| Stop | Arbitrary | Beyond the trigger and the next level |
| Decision | Usually skip | Worth assessing |
The strongest locations are where a retracement level meets an old breakout level or a zone you had already marked. Our guide to ranking key levels by how much they count helps you judge that, and drawing supply and demand zones gives you zones to compare with the grid.
For the trigger, we use the same candles we would use anywhere else: a pin bar with a clear rejection wick or an engulfing close back in the trend’s direction.
Worked example: a pullback to the 50% level
Example (hypothetical): an index rises from a swing low at 7,400 to a new high at 7,600, a 200-point move. The 38.2% level sits at about 7,524, the 50% level at 7,500 and the 61.8% level at about 7,476. The old resistance that price broke on the way up was also at 7,500.
Price pulls back to 7,500 and prints a bullish pin bar that closes at 7,505. The stop goes below the pin’s low and the 61.8% level, at 7,470, so the risk is 35 points. The first target is a retest of the 7,600 high, 95 points away.
On a £5,000 account risking 1%, the trader can lose £50, so the stake is £50 ÷ 35 = about £1.43 per point, rounded down to £1.40. Our guide to calculating position size for spread bets and CFDs shows this step in detail. Spread bets and CFDs are leveraged, so a fast market or a gap can fill the stop at a worse price and the loss can be larger than planned.

Common mistakes
- Drawing on a range. Without a trend there is nothing to retrace. Wait for the early signs of a new trend first.
- Picking the swing after the fact. Fix your anchor rule before you look for a bounce.
- Buying the touch. A line is not a trigger; wait for a candle to close.
- Stops exactly on a level. Price often overshoots, so place stops beyond the structure, as covered in where to place a stop loss with price action.
- Trusting old charts. Test your rules on unseen data; our guide on backtesting a strategy without fooling yourself explains how.
Frequently asked questions
Which Fibonacci retracement level is the strongest?
No level is reliably stronger than the others. Traders watch 50% and 61.8% most, so reactions there may be more visible, but the level that matters is the one that lines up with existing support or resistance.
Is 50% a Fibonacci level?
No, 50% does not come from the Fibonacci sequence. Platforms include it because traders have long watched the halfway point of a move.
Should I draw Fibonacci on wicks or closing prices?
Either is used, and neither is proven better. Pick one, write it into your plan and apply it every time so your levels are comparable.
What is the difference between Fibonacci retracement and extension?
Retracement levels sit inside the last swing and measure the pullback. Extension levels, such as 161.8%, project beyond the swing and are used by some traders as rough profit targets.
Next steps
Start with the trend and the swing, then treat any Fibonacci level as one piece of confluence. Our complete guide to price action trading puts these pieces together, and the sibling article on spotting weakening moves with RSI divergence covers another tool traders use near pullback zones.
Supply and demand, price action with technical analysis and a filters and trigger process are all part of our price action trading course, and the basics section is free to start.
This article is for education only and is not financial advice. Trading leveraged products such as CFDs and spread bets carries a high risk of losing money.