
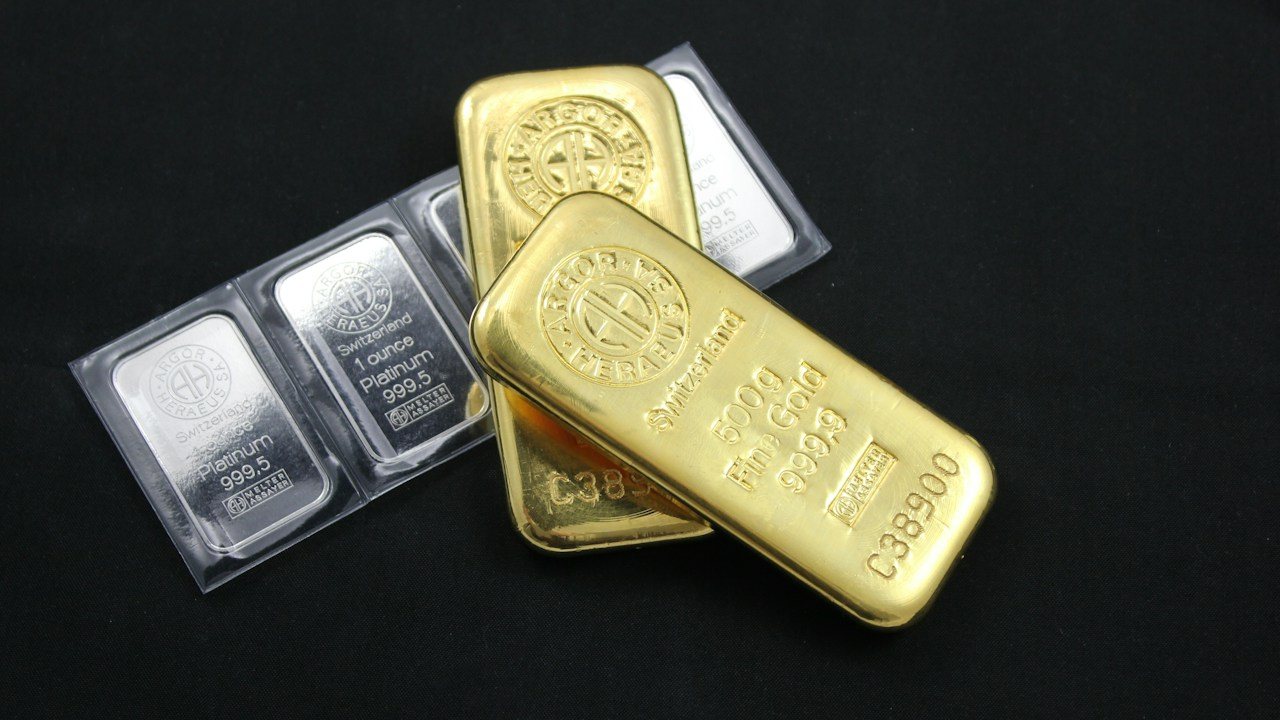
The gold silver ratio is the number of ounces of silver it takes to buy one ounce of gold, found by dividing the gold price by the silver price. Traders watch it to judge whether silver looks cheap or expensive compared with gold, but it measures relative value, not where either metal will go next.
Quick answer: what is the gold silver ratio?
The gold silver ratio is the gold price per ounce divided by the silver price per ounce. A reading of 80 means one ounce of gold costs the same as 80 ounces of silver. A rising ratio means gold is outperforming silver; a falling ratio means silver is outperforming gold. It describes relative value, not direction.
How to calculate the gold silver ratio
The maths is one division. Take both prices in the same currency and the same unit, normally US dollars per troy ounce, and divide gold by silver.
Example, with hypothetical prices: gold at $2,400 and silver at $30 gives 2,400 divided by 30, a ratio of 80. If gold stays at $2,400 and silver rises to $32, the ratio falls to 75.
Most charting platforms let you plot XAUUSD divided by XAGUSD as a single line. That ratio chart is the most useful way to see it, because one number on its own tells you very little.
What a high or low ratio means
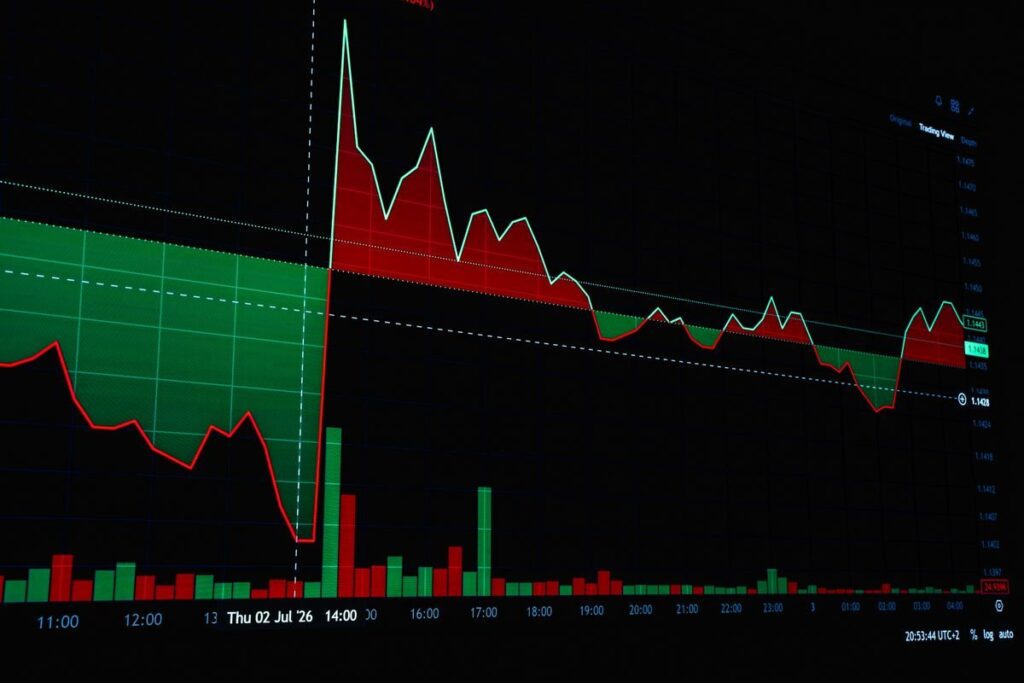
A high reading means silver is cheap compared with gold, and a low reading means silver is relatively expensive. Neither tells you whether the metals themselves are cheap or dear in absolute terms.
Why silver usually makes the bigger moves
Silver is a smaller market than gold and has heavy industrial demand, so it tends to swing harder in both directions. The BIS Quarterly Review of March 2026 describes silver doubling over 2025, rising by over 50 percent in January 2026 and then falling by about 30 percent in a single day, while gold followed a similar but less extreme pattern.
The same review says leveraged ETF rebalancing and margin-triggered selling amplified the swings, particularly in silver. That is why the ratio often falls when metals rally hard and rises sharply when they sell off.
What tends to push the ratio around
Gold is held mainly as a store of value, by central banks, funds and private buyers, so it often holds up better when investors are nervous. Silver sits between a precious metal and an industrial input, so it is more exposed to the economic cycle and to speculative flows.
In practice that means the ratio often rises in periods of stress, when gold is in demand and industrial metals are not, and falls when risk appetite is strong. These are tendencies we watch for, not rules, and there are plenty of exceptions.
The problem with “average”
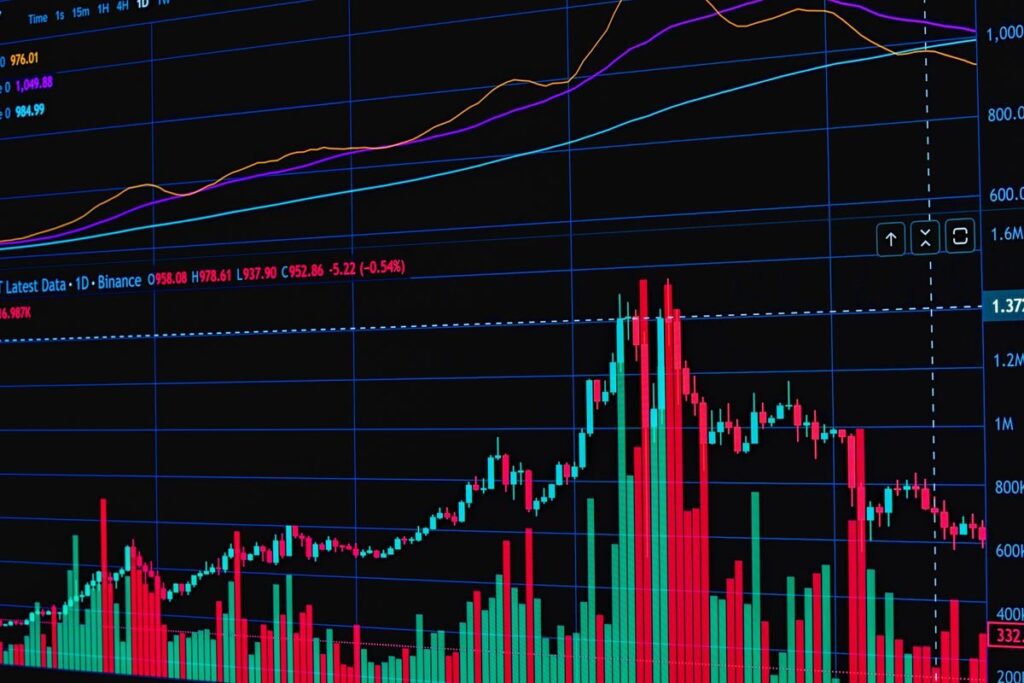
You will often read that the ratio is above or below its long-term average. That average depends heavily on the start date chosen, and the ratio can stay away from any average for years, so treat it as context rather than a target.
| Ratio movement | What it says | What it does not say |
|---|---|---|
| Rising | Gold outperforming silver | That gold is rising |
| Falling | Silver outperforming gold | That silver is rising |
| High versus its history | Silver cheap relative to gold | When it will turn |
| Low versus its history | Silver dear relative to gold | That silver must fall |
Ways traders use the ratio
We see three common uses, from the simplest to the most demanding.
- As context for a single metal. If you trade gold, a sharply rising ratio warns that silver is weaker, which can matter if both metals are testing levels together.
- To choose which metal to trade. If you have a bullish view on precious metals, the ratio’s trend can suggest which one is showing more strength.
- As a ratio, or pairs, trade. Buy one metal and sell the other in equal money value, so the result depends on the ratio rather than on the direction of both metals.
Gold and silver usually move together, so holding both in the same direction is close to doubling one bet. Our guide to correlation and doubled risk in forex trading explains the same problem with currency pairs.
Price action still comes first
The ratio never replaces the chart. We still mark zones on gold the way our guide to XAUUSD supply and demand zones describes, and we pick the hours when gold is most liquid, covered in our article on the best time to trade gold in the UK.
Worked example: a hypothetical ratio trade
All prices are hypothetical. Gold is at $2,400 and silver at $30, so the ratio is 80. A trader expects silver to outperform and sizes both legs at $6,000.
- Long silver: $6,000 divided by $30 is 200 ounces.
- Short gold: $6,000 divided by $2,400 is 2.5 ounces.
Three possible outcomes
- Ratio falls to 70: gold $2,450 and silver $35. Silver gains 200 times $5, which is $1,000; the gold short loses 2.5 times $50, which is $125. Net gain $875.
- Both metals fall, ratio unchanged: gold $2,160 and silver $27. Silver loses $600 and the gold short gains $600, so the net is zero before costs.
- Ratio rises to 84: gold $2,520 and silver $30. Silver is flat and the gold short loses 2.5 times $120, which is $300. This is where a planned exit should sit.
Holding two positions means two spreads and, with spread bets or CFDs, overnight funding charges on both legs. Both products are leveraged, so a fast move against either leg can cost more than the plan allows; our guide to margin and leverage for beginners explains why.
Common mistakes when trading the ratio
- Reading it as a buy call for silver. A high ratio can coincide with both metals falling.
- Sizing the legs in ounces, not money. One ounce of gold and one ounce of silver are very different exposures.
- Expecting a quick return to the average. The ratio has no deadline, which is the core risk in any mean reversion trading approach.
- Ignoring silver’s volatility. Silver’s swings can dominate the result, especially in leveraged products.
- Forgetting costs. Funding on two positions adds up over weeks.
Frequently asked questions
Is a high gold silver ratio a reason to buy silver?
Not on its own. It says silver is cheap relative to gold, but both metals can keep falling, so we would want price action to agree first.
Where can I see the gold to silver ratio?
Many charting platforms let you divide XAUUSD by XAGUSD to plot it. You can also calculate it yourself from any two prices quoted in the same currency and unit.
Why does the ratio change so much?
Mainly because silver is more volatile than gold. Industrial demand, a smaller market and leveraged flows can all move silver further and faster.
Can you trade the ratio with spread bets?
Yes, by holding opposite positions in the two metals sized by money value. Both legs are leveraged and each carries its own costs, so the risk needs planning before entry.
Next steps
For more on reading metals charts, see our guide to price action trading on gold and how we approach trading commodities with price action.
Our price action trading course covers supply and demand and building a rules-based risk model, and the basics section is free to start.
This article is for education only and is not financial advice. Trading leveraged products such as CFDs and spread bets carries a high risk of losing money.


