

Fundamental vs technical analysis is the oldest argument in trading. Fundamental analysis asks why a market should move, using interest rates, inflation, growth and valuation; technical analysis asks where and when, using price itself. For most short-term traders the useful answer is not one or the other, but knowing which job each does best.
Quick answer: should you use fundamental or technical analysis?
Fundamental analysis studies the economic forces behind a market, such as interest rates and data releases. Technical analysis studies price, levels and trends on the chart. Longer-term traders lean on fundamentals; short-term traders lean on charts. Many traders use fundamentals for direction and context, and technical analysis for entry, stop and timing.
What fundamental analysis looks at
Fundamental analysis tries to judge what something should be worth, or where money is likely to flow, from the economic picture. For a company share that means earnings, debt and valuation. For the markets most of our readers trade, it means something broader.
- Currencies: central bank policy, inflation, jobs data and growth. Our guide to how interest rates move currencies covers the biggest driver.
- Indices: company earnings, rates and the economic cycle.
- Commodities: supply, demand, inventories and the US dollar.
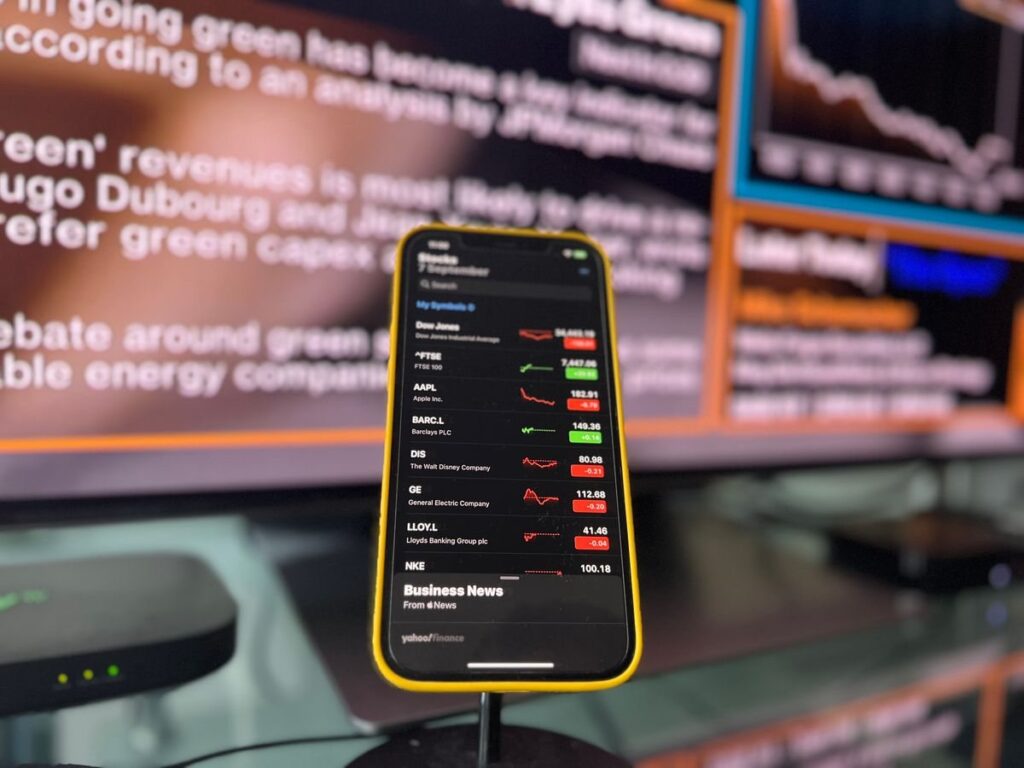
The strength of fundamentals is that they explain large, lasting moves. The weakness is timing: a market can stay “wrong” for months, and being right about the economy does not tell you where to put a stop.
What technical analysis looks at
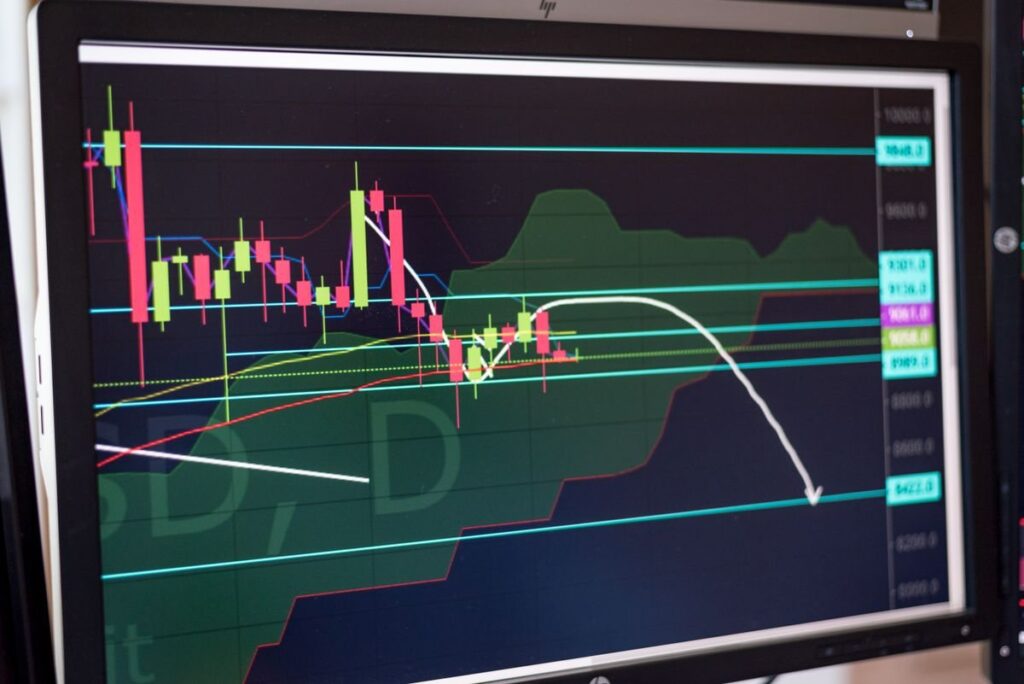
Technical analysis works from the chart: trend, structure, support and resistance, patterns and, for some traders, indicators. The working idea is that price reflects what buyers and sellers are actually doing, and that their behaviour leaves repeating footprints. Our own approach, set out in our beginner’s guide to price action trading, is a stripped-down form of it.
Its strength is precision. A level gives you a place to enter, a place to be proven wrong and a target, which makes risk measurable. Its weakness is subjectivity: as researchers at MIT put it, chart patterns are often “in the eyes of the beholder”. The same study, Lo, Mamaysky and Wang’s Foundations of Technical Analysis, also found that several technical indicators did provide incremental information over 1962 to 1996, so the method is neither magic nor nonsense.
Fundamental vs technical analysis compared
Side by side, the two approaches answer different questions, which is why the comparison is less of a contest than it first looks.
| Factor | Fundamental | Technical |
|---|---|---|
| Main question | Why should it move? | Where and when? |
| Inputs | Rates, data, earnings | Price, levels, trend |
| Best timeframe | Weeks to years | Minutes to weeks |
| Gives a stop level | No | Yes |
| Typical failure | Right, but far too early | Level overrun by news |
| Time to learn | Broad reading, ongoing | Rules and screen time |
Your timeframe largely decides the balance. A position trader holding for weeks or months needs a view on the economic backdrop. A day trader rarely has time for one to matter, except on the day a big release lands.
There is also a middle ground. Positioning data, such as the weekly Commitment of Traders report, shows how large speculators are placed in futures markets. It is not a timing tool either, but it can tell you when a popular view is already crowded.
How to combine both: fundamentals for context, charts for timing
Professionals have long blended the two. A CFA Institute article on fundamental vs technical analysis described managers who use fundamentals to decide what to own and technical tools to help time when to buy and sell. For a retail trader, we use a simple version of that split:
- Form a background view. What is the central bank doing, and is the data surprising up or down? Keep it to a few lines.
- Check the calendar. Use an economic calendar for trading to see which releases could hit your market this week.
- Find the level on the chart. Mark the zone, the trend and the structure from the higher timeframe down, as in multiple timeframe analysis.
- Let price trigger the trade. Enter only when the chart confirms, with a stop beyond the level.
- Stand aside around the big release unless your plan is built for it.
The fundamental view acts as a filter, not an entry. If the chart and the backdrop disagree, that is a reason for a smaller position or no trade.
Worked example: one trade, both methods
Example (hypothetical): a trader on a £5,000 account has a mildly positive fundamental view on the pound, because recent UK inflation data came in above expectations. That is context, not a trade.
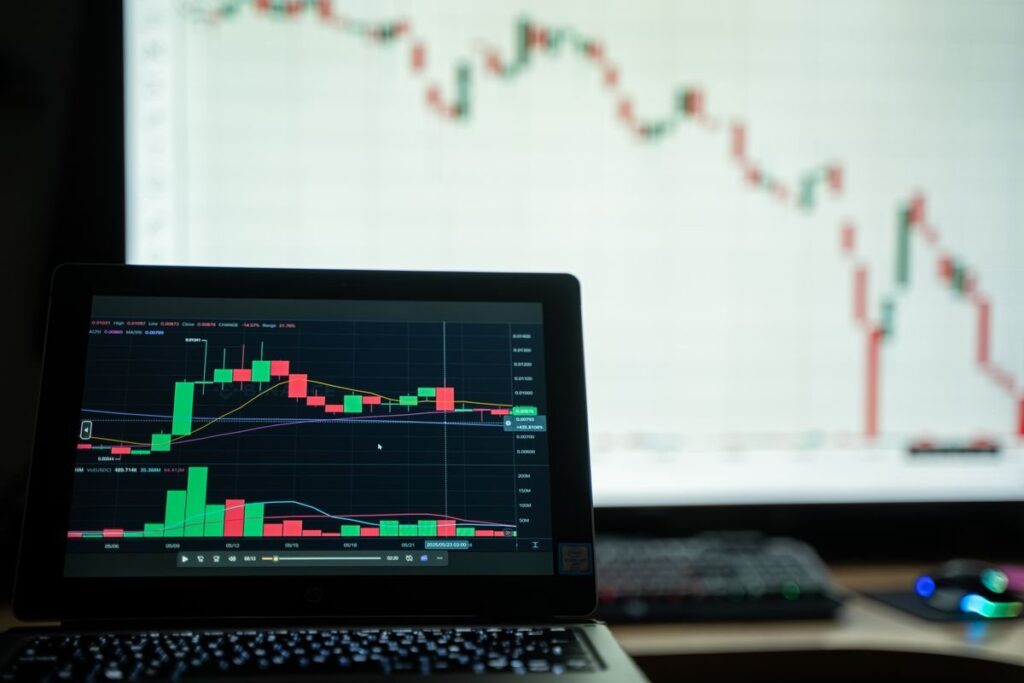
On the chart, GBP/USD has pulled back into a demand zone around 1.2500 after a higher high. The trader plans a buy at 1.2500 with a stop at 1.2460 and a target at 1.2580: 40 points of risk for 80 points of reward. Risking 1 percent, or £50, gives a spread bet stake of £50 divided by 40, which is £1.25 per point.
Checking the numbers: 40 x £1.25 is £50 at the stop, and 80 x £1.25 is £100 at the target, a 1:2 reward to risk. The calendar shows a Bank of England decision tomorrow at noon, so the plan is to close or skip the trade before it. Spread bets are leveraged, and a gap through the stop on the announcement could cost more than the planned £50.

Common mistakes
- Trading the headline. Jumping in as data prints means wide spreads and slippage. Our list of conditions when not to trade includes the minutes around big releases.
- Using a fundamental view as an entry. Being right about the economy does not stop you being stopped out five times first.
- Ignoring the calendar entirely. A perfect chart level can be wiped out by a rate decision you did not know was due.
- Collecting opinions. Ten analysts’ views is not a plan. Pick a few drivers and write them down.
- Adding indicators to fix uncertainty. More lines rarely help; see price action vs indicators for why we keep charts clean.

Frequently asked questions
Which is better for beginners, fundamental or technical analysis?
Most beginners find technical analysis easier to turn into rules, because a level gives a clear entry and stop. A basic awareness of fundamentals still matters, mainly to know when big news is due.
Is price action a form of technical analysis?
Yes. Price action is technical analysis that relies on price, structure and levels rather than indicators. It sits at the simpler end of the technical toolkit.
Can technical analysis work if fundamentals drive markets?
The two are not exclusive. Fundamentals change what traders want to do, and the chart shows how that buying and selling actually unfolds, which is why many traders use both.
What counts as fundamentals in forex?
Mainly interest rates and expectations for them, inflation, employment, growth data and central bank communication. Our guide to what moves the US dollar shows these drivers for one currency.
Next steps
Write down your background view for the one market you trade most, in no more than three lines, and check this week’s calendar against it. Then build the chart side into your written trading plan.
Price action with technical analysis, and when not to trade, are both part of our price action trading course, and the basics section is free to start.
This article is for education only and is not financial advice. Trading leveraged products such as CFDs and spread bets carries a high risk of losing money.


