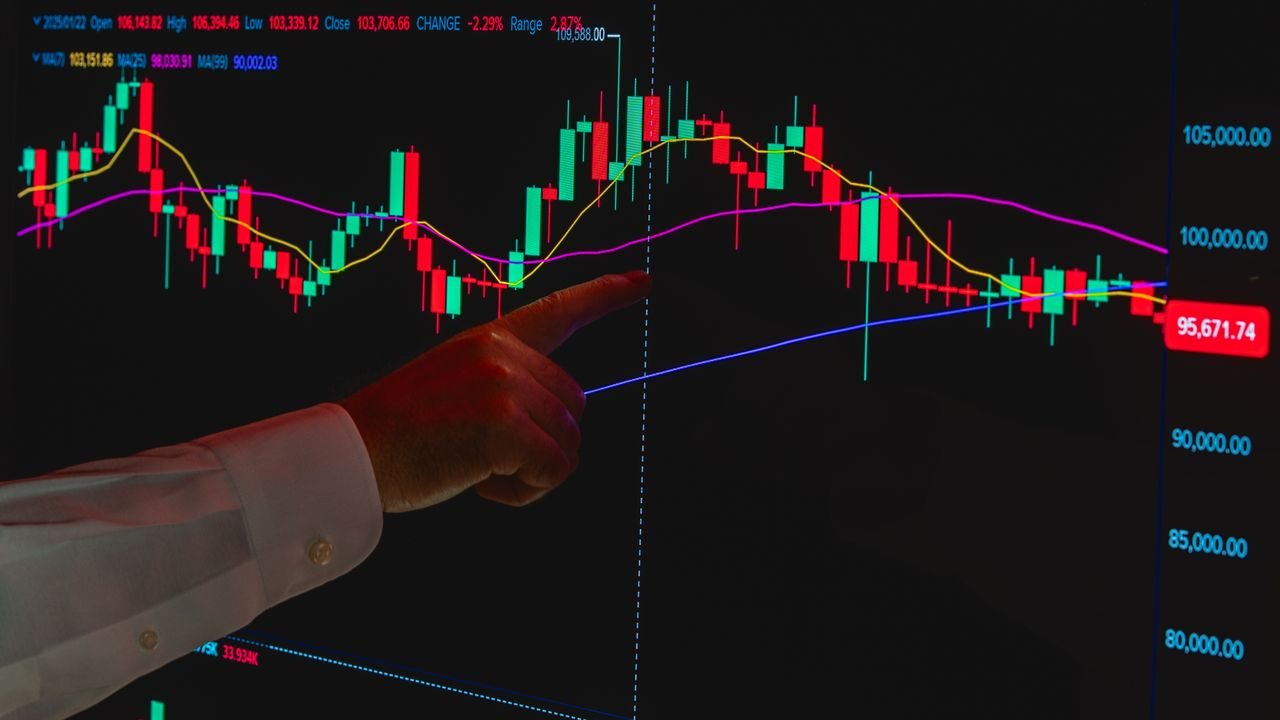

Buying at all time highs is neither automatically smart nor automatically reckless. A market at a record has no sellers above it from earlier highs, and momentum research suggests strength often persists. But late entries, gaps and sharp pullbacks are real risks, so the answer depends on where you enter and how you limit the loss.
Quick answer: is buying at all time highs a good idea?
It can be, but only with a plan. Prices at a record high have no overhead resistance and often carry momentum, yet late entries and sharp reversals are common. Price action traders usually wait for a pullback towards the old high, place a stop below structure and keep risk per trade small.
What an all time high means on a chart
An all time high is the highest price a market has ever traded. Once price moves above it, there is no earlier price to the left of the chart where traders sold and are now waiting to get out. Analysts call this the absence of overhead resistance, or overhead supply.
In supply and demand zone terms, most resistance comes from areas where sellers overwhelmed buyers before. At a new high those areas simply do not exist. Price is in “price discovery”, finding a level where enough sellers appear.

That is why many traders see a breakout at all time high levels differently from a break of an ordinary swing high. There is nobody above who bought at a loss and wants their money back.
The case for buying at all time highs
The main argument is momentum. Markets that have been rising tend, on average, to keep rising for a while. In a well-known NBER working paper on the profitability of momentum strategies, Jegadeesh and Titman found that momentum profits in US stocks continued through the 1990s, after they were first documented.
A record high is often the clearest sign of that strength. It usually comes after a series of higher highs and higher lows, the basic structure we teach in how to spot the start of a new trend. Buying into strength means trading with the trend rather than guessing where it ends.
- No overhead supply from earlier highs.
- Momentum and trend on your side.
- Clear reference level: the old high becomes a natural place to judge risk.
- Many people fear the top, so prices can travel further than expected.

The case against: late entries, gaps and reversals
The same research has a sting in the tail. Jegadeesh and Titman found no significant reversal in the two to three years after the momentum period, but significant reversals four to five years later. Strength persists for a time, and then markets tend to give some of it back.
For short-term traders the bigger dangers are practical:
- Late entries. Buying days after the break, far above the old high, leaves no sensible place for a stop.
- False breakouts. Price pokes above the record, traps buyers and falls back into the range.
- Gaps. News outside market hours can open price well beyond your stop.
- Mean reversion. Overextended moves often snap back towards an average before trending again.
- No targets. With no prior level above, setting a profit target is guesswork.

| Arguments for | Arguments against |
|---|---|
| No overhead resistance | No obvious profit target |
| Momentum tends to persist | Longer-run reversals are documented |
| Trading with the trend | Entries are often late and stretched |
| Old high gives a clear risk level | False breakouts trap buyers |
| Fear of the top keeps sellers cautious | Gaps can jump past stops |
Our view: the high itself is not the problem. The problem is buying without a defined risk, or so far from the breakout that one normal pullback hurts. That is exactly the question we ask in is this trade worth the risk.
How price action traders handle a breakout at all time high
We do not chase. Our approach to an all time high trading strategy follows the same logic as any breakout trading plan, with extra care on stops and exits:
- Confirm the break. Wait for a candle to close above the old high, not just a wick.
- Wait for a pullback. Look for price to come back towards the old high and hold it as support.
- Find a trigger. Use your normal entry signal at that level, as in our filters and triggers entry checklist.
- Stop below structure. Place the stop under the pullback low or back inside the old range.
- Size from the stop. Work out the position so a stop-out costs a fixed, small slice of the account.
- Trail, don’t target. With no level above, move the stop under each new higher low.

If price never pulls back, we accept missing the move. There will be another setup, and a missed trade costs nothing.
Worked example
Example: on a £5,000 account, a trader risks 1% per trade, which is £50. A market breaks a record at 100, then pulls back and holds at 101. The trader buys at 101 with a stop at 98.5, back inside the old range, so the risk is 2.5 points.
£50 divided by 2.5 points gives a size of £20 per point on a spread bet. Spread bets are leveraged, so losses can exceed what you expect if price gaps through the stop. If the trade works, the stop trails under each new higher low instead of aiming for a fixed target. See our guide to calculating position size from your stop for the full method.
Common mistakes
- Buying out of fear of missing out. Entering because headlines say “record high” is not a setup.
- Placing no stop because “it can only go up”. Read why every trade needs a stop loss.
- Shorting simply because price is high. A record is not a reason to sell; it needs a reversal setup of its own.
- Using a fixed profit target. In price discovery, a trailing stop usually fits better.
- Oversizing on conviction. Strong trends still produce sharp pullbacks.

Our desk wrote about markets at records in the past, such as the November 2017 note on crypto at all time highs and GBP critical levels. Those posts are historical and show how quickly conditions change.
Frequently asked questions
Do markets keep rising after an all time high?
Often they do for a while, because momentum tends to persist, but not always. Research also documents reversals over longer periods. Treat a new high as a sign of strength, not a promise.
Should I wait for a pullback before buying?
Waiting for a pullback to the old high usually gives a tighter stop and a better price. The trade-off is that strong markets sometimes never pull back. Many price action traders accept missing those moves.
Where do you put a stop at an all time high?
Below the structure that proves you wrong: under the pullback low or back inside the old range. Then size the position from that distance so the loss stays small.
How do you set a target with no resistance above?
Most traders use a trailing stop under higher lows rather than a fixed target. Some take partial profit at a set reward-to-risk ratio and trail the rest.
Next steps
For the full method behind these steps, start with our complete beginner’s guide to price action trading and practise reading price action step by step. If you want structured lessons, the basics section of our price action trading course is free.
This article is for education only and is not financial advice. Trading leveraged products such as CFDs and spread bets carries a high risk of losing money.