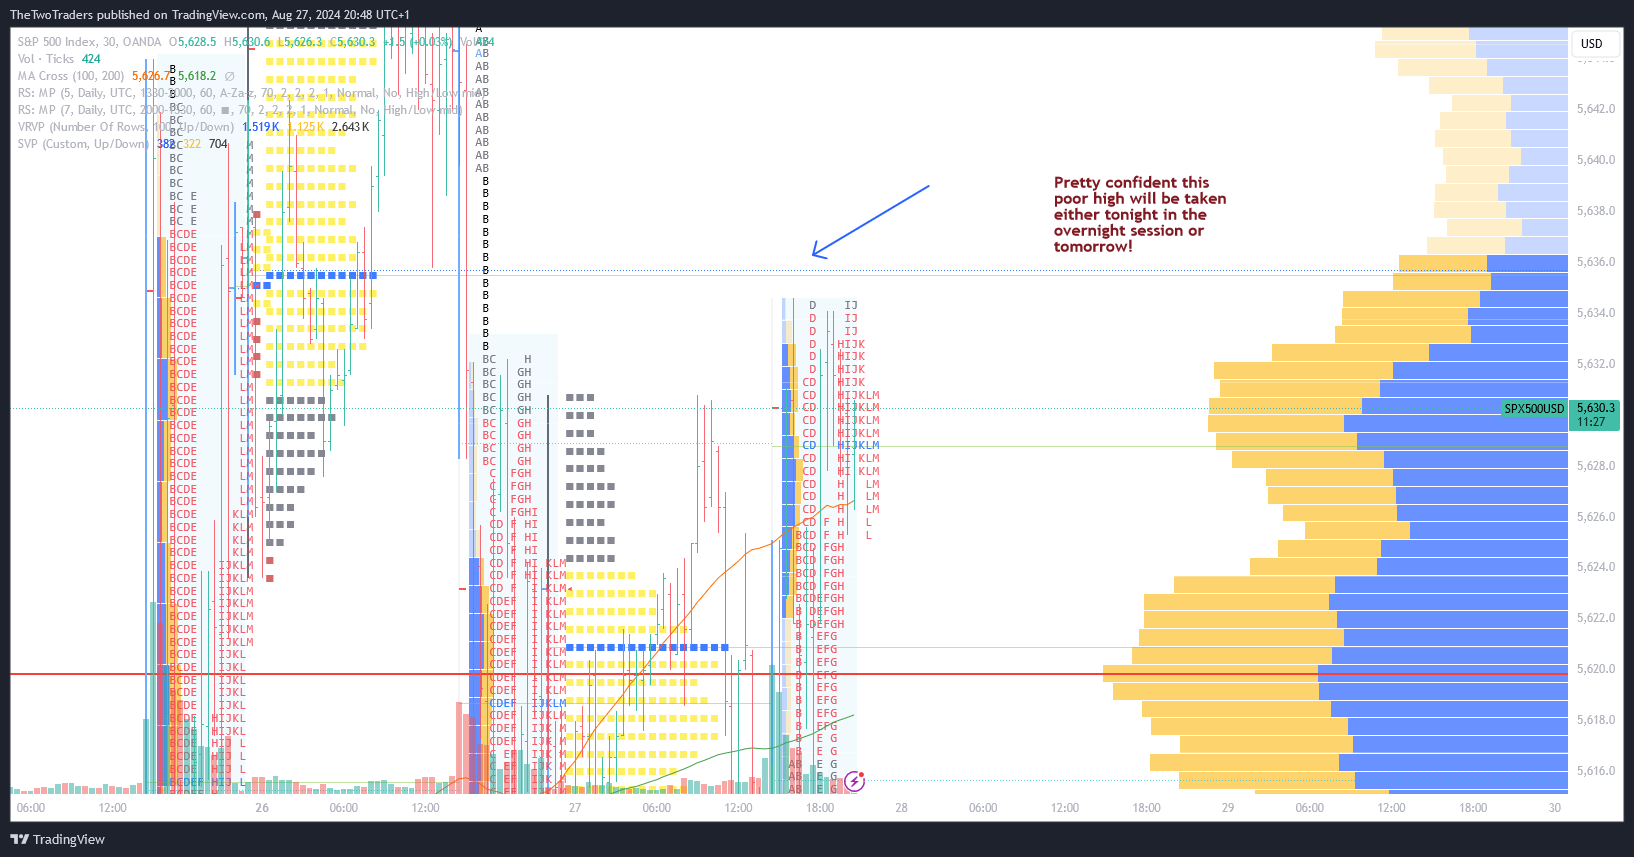
The US500, representing the S&P 500 index, has seen a dynamic trading year so far in 2024, with market volatility creating both challenges and opportunities for traders. In this blog post, we’ll explore the current state of the US500, delve into how Market Profile analysis can provide valuable insights, and discuss effective short-term trading strategies for navigating this ever-changing market.
The US500 Market in 2024: A Year of Volatility and Opportunity
As we progress through 2024, the US500 has experienced significant fluctuations, driven by a mix of economic data releases, corporate earnings reports, and geopolitical tensions. The index, which tracks the performance of 500 of the largest companies listed on U.S. stock exchanges, remains a bellwether for the overall health of the stock market.
Key Events Shaping the US500 in 2024
- Economic Indicators: The Federal Reserve’s monetary policy decisions, inflation data, and employment figures have played crucial roles in driving market sentiment. A mixed bag of economic indicators has resulted in periods of both optimism and caution among investors.
- Corporate Earnings: As companies continue to report their quarterly earnings, surprises—both positive and negative—have caused sharp movements in the index. Sectors like technology and energy have been particularly volatile.
- Geopolitical Tensions: Ongoing geopolitical issues, particularly those related to trade policies and global economic partnerships, have injected additional uncertainty into the market.
Leveraging Market Profile for Real Market Insights
Market Profile is a powerful tool that can provide traders with deep insights into the US500 market. By analyzing price action over time and identifying value areas, points of control (POC), and high-volume nodes, traders can better understand where significant buying and selling activity is occurring.
What is Market Profile?
Market Profile is a charting technique that plots price distribution over time. It helps traders identify key price levels where the market has spent the most time and where the most trading activity has occurred. This method divides the trading session into multiple time frames (usually 30-minute segments), allowing traders to see the development of the market throughout the day.
Key Components of Market Profile:
- Value Area (VA): The range of prices where 70% of the trading activity occurred during a specific period. The value area helps traders understand where the market finds “fair value.”
- Point of Control (POC): The price level with the highest trading activity. The POC acts as a key reference point for traders, often indicating strong support or resistance.
- High and Low Volume Nodes: Areas on the profile where significant buying or selling has occurred. These can be pivotal in identifying potential breakout or breakdown zones.
How Market Profile Provides Real Insights
- Identifying Market Sentiment: By observing where the majority of trading activity takes place, traders can gauge the market’s sentiment—whether it’s bullish, bearish, or neutral.
- Spotting Breakout and Breakdown Points: Market Profile can highlight significant support and resistance levels. Breaks above or below these levels can indicate potential trading opportunities.
- Understanding Market Dynamics: It helps traders understand who is in control—buyers or sellers. For example, a shift in the POC to higher prices may suggest strong buying pressure and a potential upward trend.
Short-Term Trading Strategies for the US500 Using Market Profile
Short-term trading on the US500 can be highly profitable, especially when combined with Market Profile analysis. Here are some effective strategies:
1. Value Area Trading
Trading within the value area is a popular strategy among short-term traders. The idea is to buy when prices are near the lower end of the value area and sell when they approach the upper end. This strategy assumes that prices will revert to the mean, making it ideal in a range-bound market.
- Entry Signal: Enter a long position when the price approaches the lower boundary of the value area with signs of support or buying strength.
- Exit Signal: Exit the position as the price nears the upper boundary of the value area or shows signs of resistance.
2. Breakout Trading Using POC
Breakout trading focuses on identifying when the price breaks through key levels, such as the Point of Control (POC) or the boundaries of the value area.
- Entry Signal: Enter a long position if the price breaks above the POC with significant volume, indicating a breakout to the upside.
- Exit Signal: Place a stop-loss just below the breakout level to manage risk, and target a price level identified by the next high-volume node or previous swing high.
3. Fade the Extremes Strategy
This strategy involves trading against the extremes of the Market Profile—selling at the upper extreme and buying at the lower extreme, expecting a reversal towards the value area.
- Entry Signal: Enter a short position at the upper extreme with confirmation of selling pressure or overbought conditions.
- Exit Signal: Exit the position as the price moves back towards the value area or POC.
Conclusion: Navigating the US500 with Market Profile
The US500 has offered a complex yet rewarding landscape for traders in 2024. By leveraging Market Profile, traders can gain real insights into market behavior, identify key levels of support and resistance, and refine their short-term trading strategies. Whether you’re a seasoned trader or just starting, understanding how to use Market Profile can significantly enhance your trading decisions and performance.
To stay updated with the latest market analysis and trading strategies, be sure to subscribe to our newsletter and explore more articles on our website. Happy trading!
By integrating these strategies and insights into your trading routine, you can better navigate the US500 market’s volatility and seize profitable opportunities.
Learn to trade here


