All markets move in cycles and the crypto-asset market is no different. Indeed, each market has its own ‘personality’ with varying degrees of volatility, seasonal tendencies, correlations, cycle durations and what not. So this article will give a quick overview of the crypto-asset market for investors looking to participate in the upside.
To start off, let us have a look at the brief history of the market to understand where we find ourselves today. Everyone remembers when BTC reached $20K in December 2017. It was a moment of absolute euphoria as Bitcoin introduced itself to the world, moving away from the shadows as solely a tool for organized crime. Following the top we had an ‘Alt-season,’ which is a term to describe the regime when the alternative cryptocurrencies – everything that is not Bitcoin – outpace the ‘king’ and gain market share. Following that top, we have been in a bear market which has been extended because of the pandemic.
But in the summer of 2020 a small crypto niche exploded, resulting in what is now remembered as the “DeFi Summer”. This was possible because many projects kept building in the bear market, and it so happened that in 2020’s the composability of the open-source protocols started lending themselves to developers who were willing to build on top of them. In other words, foundational protocols such as Maker, Compound and Kyber were robust enough to allow other developers to use them as building blocks in their own projects (analogously, they can be seen as ‘money Legos’). As a result, there were new ways to make markets (Automated market makers), bootstrap liquidity (liquidity mining), earn yield (yield farming), as well as new forms of synthetic assets, to name a few. Naturally, this spurred a mini-bull market in the ‘Decentralized Finance’ space (DeFi), which also spilled over to the Non-fungible token sector (NFT) near the end, given the open-source nature of the protocols.
Following this, we had a correction at the end of September as Bitcoin broke $12K and started its parabolic run, with Ethereum following shortly thereafter. Now we find ourselves in a corrective period with ETH/USD having just touched its previous all-time high. So how do we move forward from here?
Well, historically when ETH/USD breaks it’s all time high the market is in a state of ‘risk-on’. This means that liquidity is increasingly moving into higher risk plays (i.e. altcoins). This is what the market is waiting for at the moment. Having cleaned out the supply-side liquidity resting at the all-time high, price has corrected to find some buy-side liquidity. Now price is retesting the highs.

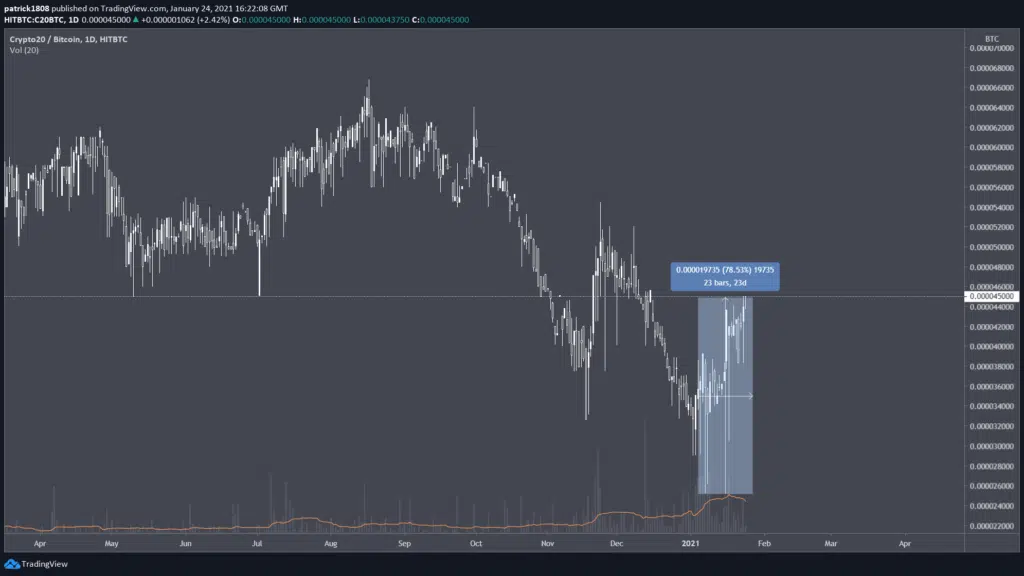
As for the major altcoins, the following chart is an index of the top 20 coins by market cap, charted against BTC. We can see that in the in Q4 2020, when BTC started its meteoric rise, the alts lost comparatively. But in the last few week, as BTC found a local top, the major alts started gaining comparatively.

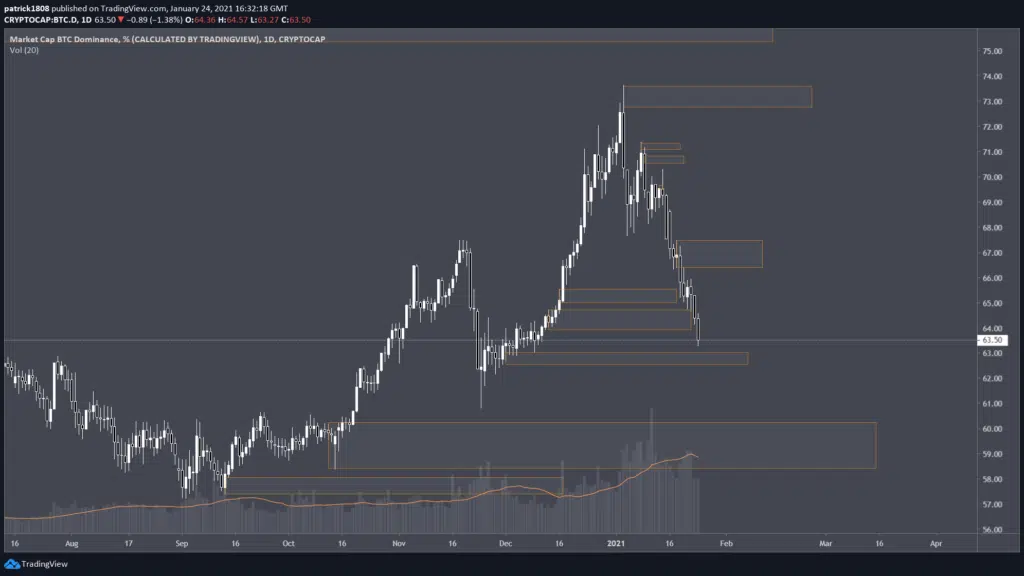
Likewise, in the next chart we see BTC dominance trending downwards. In light of this, what I am currently looking for is BTC to remain in its consolidation without any impulsive moves up or down, and ETH/USD to break into price discovery. If this occurs, alt-season is confirmed.

Now, how should we approach this regime? Well, this will depend on your trading style and risk profile. But it’s important to note that we do not give financial advice at The Two Traders. Instead I will outline how I am approaching this regime. I am predominantly a swing trader, holding my trades from a few days to a few weeks. Having been in the space for a few years now, I am used to the volatility and big drawdowns inherent to these illiquid markets.
To note, my aim in the alt-season is to accumulate BTC, so I chart predominantly against BTC. This is because I maintain the view that BTC will find its top for this cycle somewhere between $100K – $300K, allowing me to compound my ALT/BTC gains with BTC/USD. My macro view on the markets is derived mostly from charting BTC dominance on TradingView (CRYPTOCAP:BTC.D); the total market cap (CRYPTOCAP:TOTAL); the altcoin market cap (CRYPTOCAP:TOTAL2); and different volatility measures (which are now behind a paywall, unfortunately). I look for potential market-wide retracements at key high time frame levels (e.g. Dominance levels).
There are also some on-chain metrics I find useful to identify potential tops and bottoms (but my focus is always on price action). These metrics help me identify what the ‘smart money’ is doing and what is moving the markets: if it’s a lack of bids/offers or an influx of new bids/sellers. This non-exhaustive list includes: MVRV, Token Age Consumed, Net Exchange Flow, SOPR. Please see Santiment, The Block, Woonomic, Dune Analytics, or Glassnode for more metrics – they share many metrics but also have alternative ones. Altcoins tend to move on the weekends and bank holidays, as institutions are not really in the alt market space yet.
For my entries, I take most risk on established mid-caps with a strong fundamental use case (I consider mid-caps to be ranking between 21 – 150 on CoinGecko). This is because they have the highest RR, versus large caps and small cap. The large caps return less, and the small caps have higher risk of failing or being scams. I will focus on the DeFi, NFT, enterprise blockchain and social token sectors as that is where the momentum is. This is not to say that I will exclude other sectors such as Web 3.0, exchange tokens, privacy tokens, DAOs, middleware and whatnot, since there are some very promising projects there too. Importantly, I do not FOMO my entries because the market does pullback (often 20% – 30%). I do still find it difficult sometimes to hold onto my positions that do not move while watching the rest of the market pump. But since the crypto-asset sectors are still quite correlated with each other, historical data suggests that the rising tide lifts all boats.
For my exits, I adopt a trend-following approach because price does pullback often before continuing its trend higher. So I wait for a market structure shift on high-timeframes, from the H8, H12, and D1 timeframes for confirmation before exiting fully (the smaller the market cap of the project, the lower ‘high-timeframe’). I am not afraid of losing some gains at the top of the market, because this way I can ensure I ride the trend to the end, which often varies between 3X – 10X. In my experience, losing 20% -30% here and there does payoff for gaining 100-300% extra elsewhere. But I definitely do take profits also on the way up: this is key because the markets can turn at any moment. This volatility is also why I am not comfortable with leverage in the crypto-markets because the drawdowns on an overnight basis are often large enough to cause mass liquidations; and I don’t like stressful mornings!
On a practical note, I chart mostly on TradingView. For coins that are not listed there I look on coinstrader.pro or chartex.pro. I trade predominantly on Binance, FTX and Uniswap. I search on Coingecko for the exchanges where I can find the coin I am interested. I track my portfolio with alerts on unspent.io and store my coins on a ledger.
I would like to conclude by saying that this is not the only way to trade this market. As long as your model works for you, then that is enough. If you are still learning to trade, I would practice on more liquid markets in forex, equities and commodities. It is possible to benefit from the upside of the crypto-asset market by taking longer term position trades on coins, while practice and developing your own trading model on more established markets. For example, I used to trade crypto indices when I was still new to cryptos and did not know how to study this market. There are a variety of indices nowadays in the crypto-sphere, my favorites being found on Iconomi, TokenSets, and FTX.
Please feel free to ask questions and concerns on our discord. This article is to serve as a primer on where we find ourselves in today and how I will be trading the coming weeks and months. I am sure there are still many questions left unanswered, and am more than happy to answer them!


